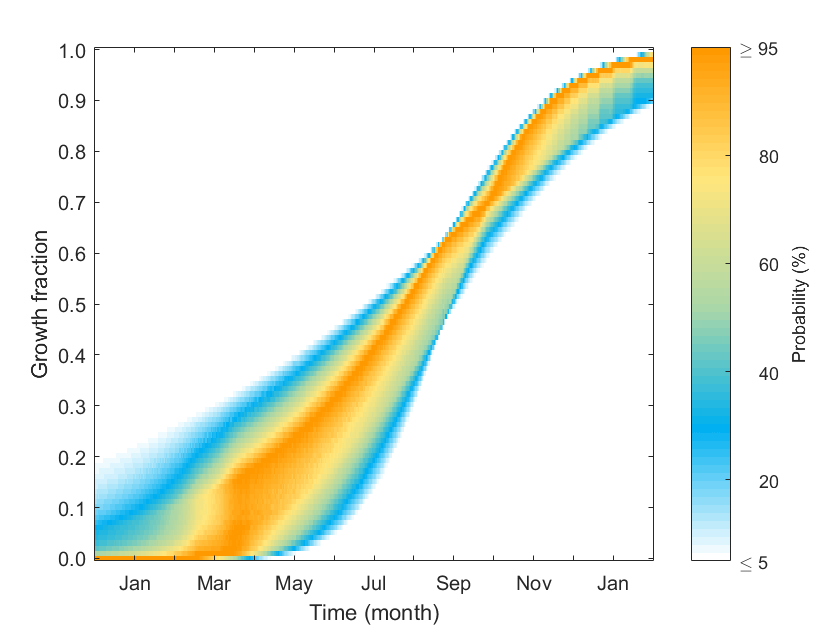
Richard's Curve and Derivative Probability Plot
Creates probability plot of the Richard's Curve and derivative given the minimum & maximum values of its 95% confidence interval parameters

You are now following this Submission
- You will see updates in your followed content feed
- You may receive emails, depending on your communication preferences
Cite As
Juan Estrella-Martínez (2026). Richard's Curve and Derivative Probability Plot (https://www.mathworks.com/matlabcentral/fileexchange/77104-richard-s-curve-and-derivative-probability-plot), MATLAB Central File Exchange. Retrieved .
Acknowledgements
Inspired by: Custom Colormap
General Information
- Version 1.0.2 (144 KB)
MATLAB Release Compatibility
- Compatible with any release
Platform Compatibility
- Windows
- macOS
- Linux
| Version | Published | Release Notes | Action |
|---|---|---|---|
| 1.0.2 | Fixed bug that calculated a lower number of family of curves. As a result, less iterations are needed to obtain a nice figure.
|
||
| 1.0.1 | 2020-06-19 6:40pm: A bug was found in the calculation of the family of curves. Working on a solution. |
||
| 1.0.0 |

