MovingAverageFilterToolbox
Version 1.0 (413 KB) by
Santosh Srivatsan
GUI program to visualize the working of a moving average filter on a set of input signals
MATLAB GUI to demonstrate the working of a Moving Average Filter
Installation
- Download the MovingAverageFilterToolbox from here.
- Open MATLAB and navigate to the directory where you downloaded the toolbox. Double click the toolbox in MATLAB's file explorer to install.
- type 'Asgn_2017A8PS1924G' in the Command Window to run (Terrible command, will fix this soon).
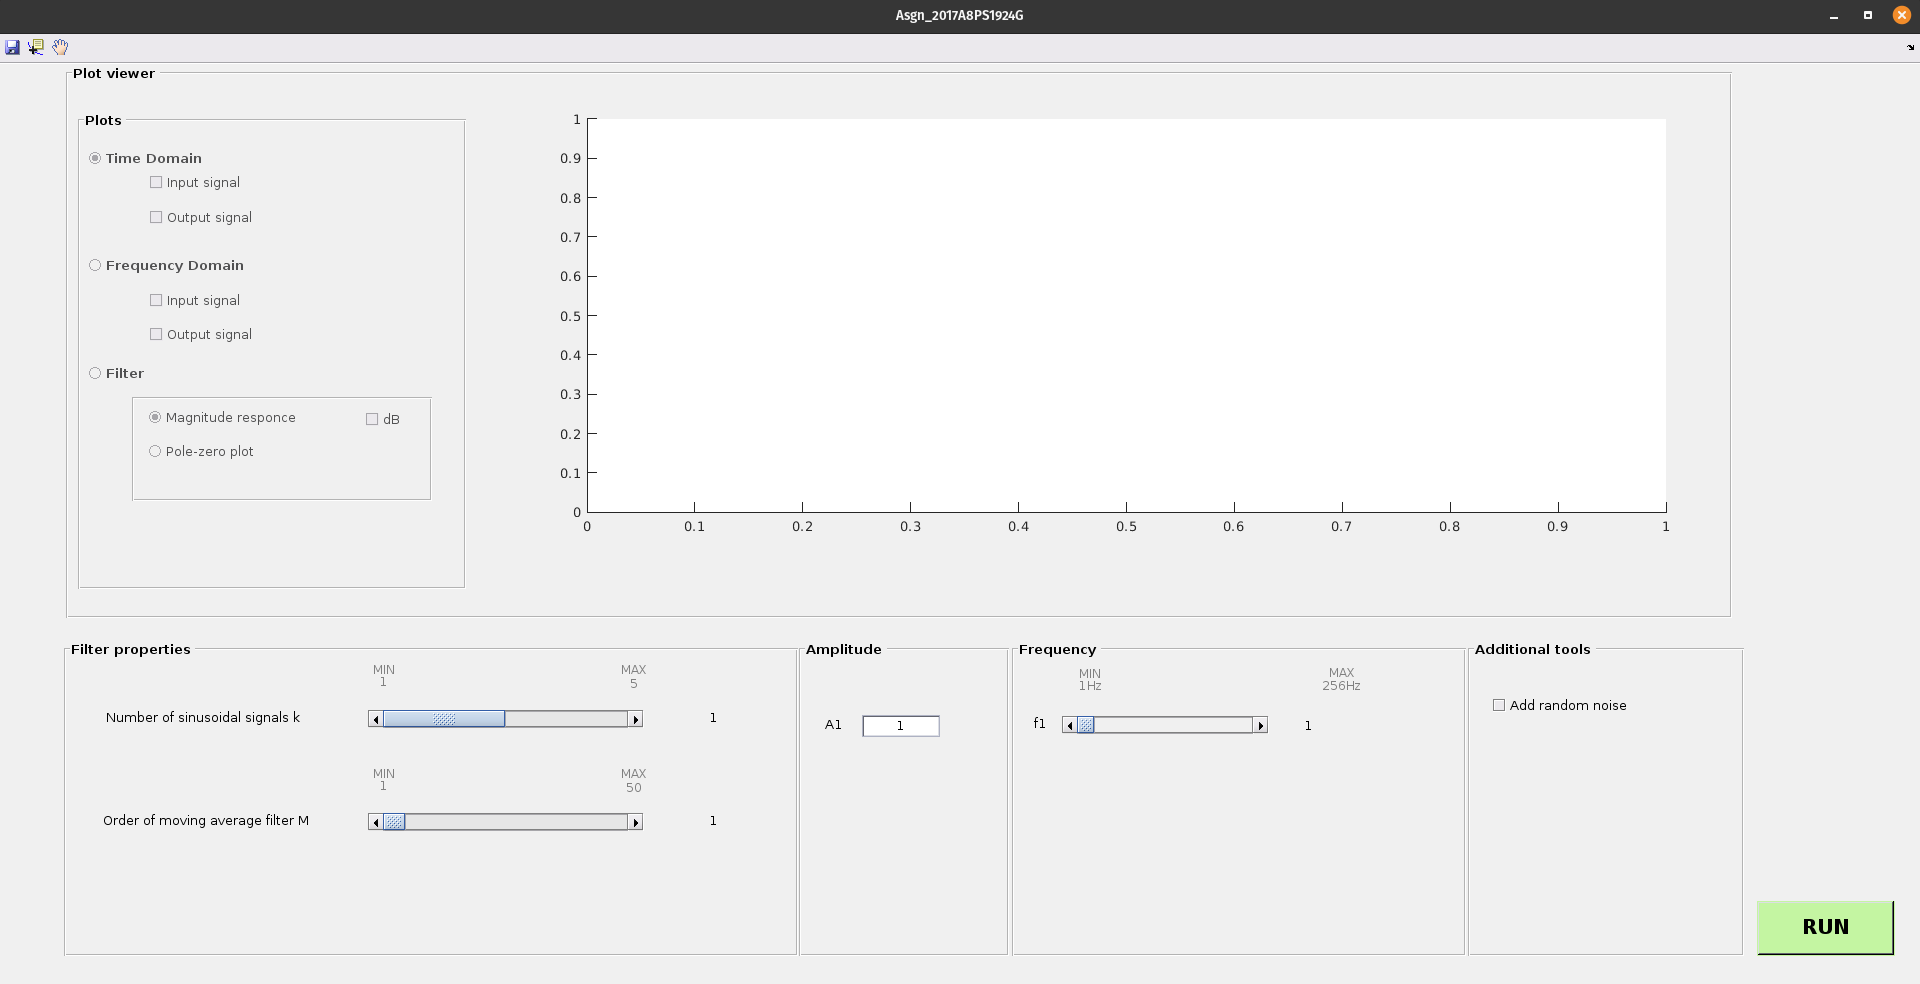
Gui Overview
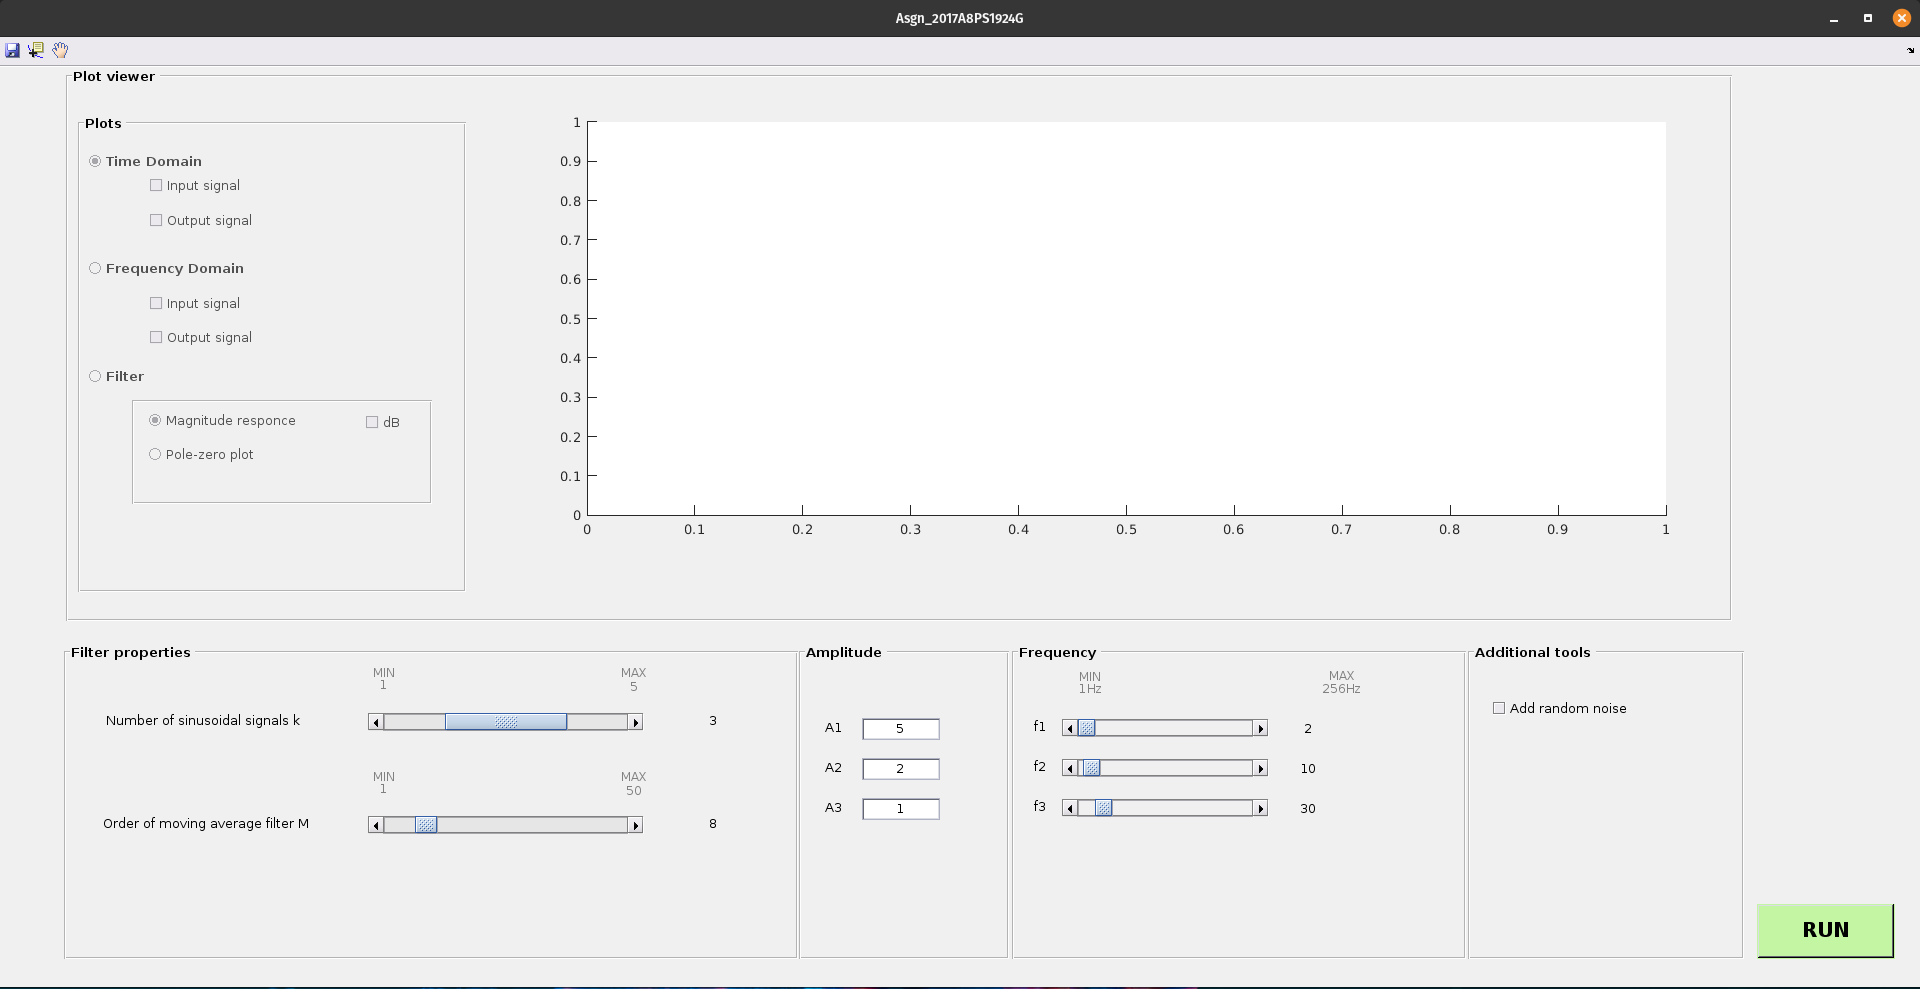
Choosing Input Parameters
- Max value of k = 5
- Max value of M = 50
- Default value of k = 1
- Default value of M = 1
- Default value of Amplitude = 1
- Default value of Frequency = 1
Notes
- The program will not throw an error if the user clicks on RUN without entering any values since every user input parameter has a default.
- The number of fields for entering values of amplitude and frequency varies based on the value of k.
- The user has an option to add random noise to the input signal
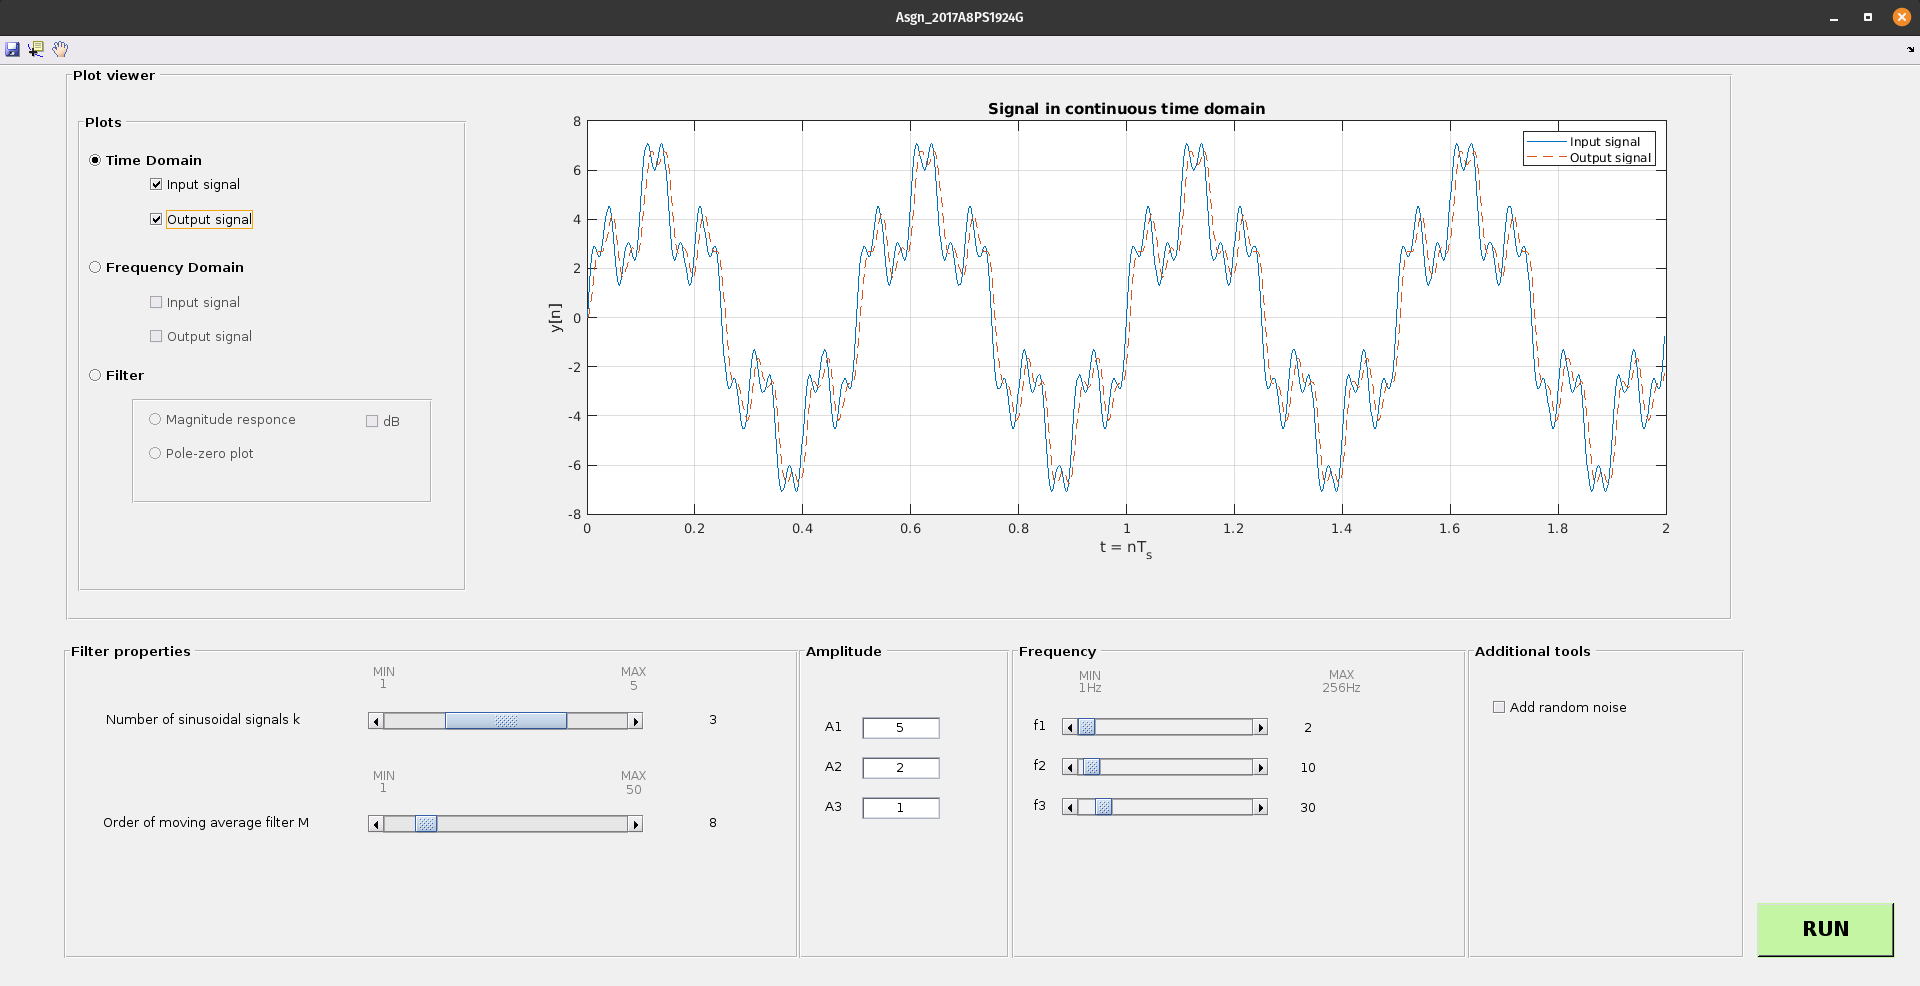
Selecting Output Plots
- Plots can be selected only after clicking the RUN button.
- Input and output signals can be plotted on the same window for comparison.
- The plot can be saved as a jpeg image using the save functionality.
Additional notes
You can find screenshots of working in the /Screenshots directory
Cite As
Santosh Srivatsan (2024). MovingAverageFilterToolbox (https://github.com/SantoshSrivatsan24/moving_average_filter/releases/tag/v1.0), GitHub. Retrieved .
MATLAB Release Compatibility
Created with
R2020b
Compatible with any release
Platform Compatibility
Windows macOS LinuxTags
Community Treasure Hunt
Find the treasures in MATLAB Central and discover how the community can help you!
Start Hunting!Discover Live Editor
Create scripts with code, output, and formatted text in a single executable document.
| Version | Published | Release Notes | |
|---|---|---|---|
| 1.0 |
|
To view or report issues in this GitHub add-on, visit the GitHub Repository.
To view or report issues in this GitHub add-on, visit the GitHub Repository.


