14,061 results
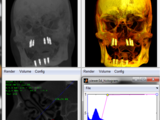
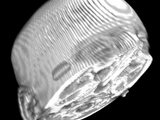
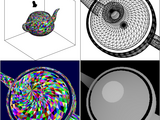
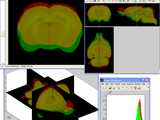
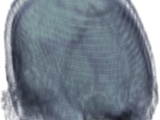
MIP, Color, Slice and Shaded 3D (shearwarp) Volume Rendering, interactive 3D view/measurement GUI
kind of renders. The fast render algorithm which renders a 3D volume to a 2D image, is based on a Matlab coded implementation of the Shear-Warp transform, in which instead of rotating the viewer rays the

Interactive viewer of 3 orthogonal slices of 3D volume.
Simple interactive viewer of 3 orthogonal slices of 3D volume and of sequence of volumes. The interaction is performed by mouse left button or keyboard arrows.
A set of demonstrations that show how to install and use an accelerated 3D viewer for MATLAB.
image visualization, processing or analysis tool.In this demo bundle, we demonstrate how to use Fiji to get a very nice, hardware accelerated, 3D viewer in MATLAB.Note on updates on these demos files: If

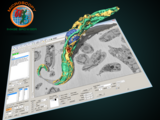
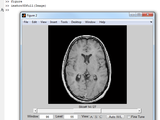
A fast 3D image viewer and slicer that provides measurement, statistics, and visualization tools.
--------------------------------------------------------------------------------A 3D image viewer, slicer and measurement tool

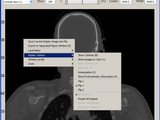
Viewer allows user to look through cross sections of a dicom image set.
The interactive viewer allows a user to select a folder with one set of dicom images. The viewer assembles the images in order and displays them as one 3D dataset. User can then scroll through and
A 3D volumetric data slice viewer for viewing 3D data in different orientations.
This tool allow users to view 3D data in different orientations slice by slice. It is useful to view 3D medical image data (or general 3D volumetric data). It supports many user interactive

3D Image Viewer with ROI tools for Matlab ( NIFTI viewer, Manual segmentation )
)- Active contour, slice interpolation for ROI- Grayscale or RGB color, gamma correction- histograms, statistics- mouse controls * imtool3D: standard viewer * imtool3D_3planes: 3 slicing planes viewer *

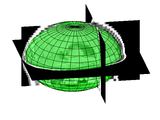
Access the OpenGL rendering pipeline directly from matlab
Exchange](https://www.mathworks.com/matlabcentral/images/matlab-file-exchange.svg)](https://www.mathworks.com/matlabcentral/fileexchange/102109-matlab-opengl)## ExamplesA few examples are included, see `doc/GettingStarted.mlx` for a brief description of some of them. You can open the files and see the inner workings.### 3D Viewer Example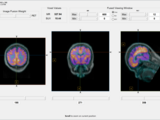
A toolbox to handle reading, viewing, and writing dicom images, supporting simultaneous PET/MR
registration - manual 3D image rotation - selecting and extracting single voxel coordinates - drawing 2D or 3D region-of-interest masks - coregistered image viewing supports PET/CT and PET/MR Syntax: CT =

View 2D or 3D data in a OpenGL viewer
Fast VisualizationFast Visualization Toolbox for MATLAB - View and interact with 2D or 3D data in a OpenGL viewerMultiple primitive types (points, lines or triangles)Multiple color choices (colormap


Simple 3D / 4D Medical Image Viewer
This is a 3D 4D viewer to visualise medical images from (mhd) files or from the workspace (ImageType format).Features:- 3D/4D image Visualisation- Image Overlay- Oblique Slicing- Visualisation of 3D

This GUI program allows you to navigate through a 3-D image with three orthogonal views.
This GUI program allows you to navigate through a 3-D image with three orthogonal views, and display the intensity value at any voxel location. You can see the intensity values by moving the mouse

An interactive viewer for 3D and 4D data sets.
This interactive image viewer is intended to explore multi-frame tomographic medical image data consisting of 3 spatial domains and a 4th domain (e.g. time, phase, energy). It is based of Sliceomatic

Small GUI for viewing 3D data with alpha mapping
Allows one to quickly view a 3D matrix of values, allowing for easy visual searching of features within your data.The matrix values are weighted with an alphamap to allow the user to make low values

Current version only accept gray-scale images. Just format your image stack into a 3D array.
A good tool to display all kinds of 3D image stacksLSM (Laser scanning microscopy) imagesCT scan (x-ray) imagesMRI imagesConfocal microscopy imagesOCT (optical coherence tomography) images

An interactive tool for users to browse through sagittal, axial and coronal views of CT/MRI images.
The function's input is just a 3D image. 3 orthogonal slice objects are created in a 3D space. You can grasp one image slice and move your mouse to see the changing image data on the slice. Their

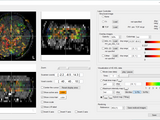
MATLAB & Bash Scripts for localizing and interactivity visualizing intracranial electrode data
MATLAB image processing, computer vision, and point cloud processing evaluation kit in Japanese

3D NIfTI data viewer based on the work of Jimmy Shen (#8797)
A Nifti 3D Viewerbased on the work done by Jimmy Shen(#8797)Added some new features:1 Open files from a tree view file browser (Menu: File -> File Browser)2 Support scroll wheel to change view3
MIB is a package for segmentation of multi-dimensional (2D-4D) microscopy datasets

Modify appdesigner component stacking order and callback order
Allows for the component order to be changed of a .mlapp file. Callback order may also be changed.Load your app into HierarchyViewer where the components all callbacks in your app are displayed. Once
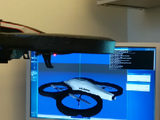
Deploy MATLAB Simulink model automatically to Parrot AR Drone with Embedded Coder C code generation

This program allows users to view the cross-sectional view of a CT or MRI volume image.
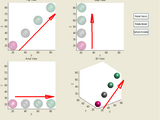
3D scatter plot
This is an easily usable 3D scatter plot function. Highly compatible with octave.
Computes/applies rotation about arbitrary 3D line.
Generates the roto-translation matrix for the rotation around an arbitrary line in 3D. The line need not pass through the origin. Optionally, also, applies this transformation to a list of 3D

A MATLAB based 3D/4D viewer for nifti images - with plotting functions
visualization ## 🎬Export figures for publications  ## 🎬Generate 3D rendered videos ## 🎬One-click capture of viewer image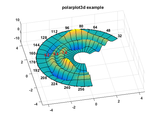
Plots 3d polar data with polar axis and polar grid
peaks(x,y); % peaks function on a polar grid % draw 3d polar plot figure('Color','white','NumberTitle','off','Name','PolarPlot3d
Interactive GUI for Image Processing, Analysis and Vizualisation, similar to ImageJ
specific "Image" class that allow to process in a unified way grayscale, binary and color images, 2D or 3D, and that can be used independently (see https://github.com/mattools/matlab-image-class).Bug reports

A statistics toolbox for neuroimaging.

Realtime signal analyzer (PDFs, correlation, audio playback and recording, spectrum analyzer)

Tool to analyze two-photon calcium imaging videos, extract neuronal activity, and identify neuronal ensembles (ONsembles and OFFsembles).
radius size of 4 pixels:Xsembles_2P('','SamplingPeriod',0.1,'NeuronRadius',4)Name-Value ArgumentsNeuronRadius, neuron radius in pixels (default is 3).SamplingPeriod, sampling period in seconds (default is
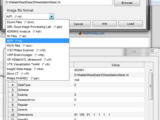
GUI to open most Medical file-formats: Dicom, V3D, ISI, NifTI, Analyze and other formats
This function ReadData3D allows the user to open medical 3D files. It supports the following formats : Dicom Files ( .dcm , .dicom ) V3D Philips Scanner ( .v3d ) GIPL Guys Image Processing

interactive 3D viewer for Matlab meshes/3D scatterplots and graphs built with unity3d
structs, 3D scatterplots and 2D xy plot data to a a cell array called xFigureObject. xFigureObject can then be viewd in an external interactive 3D viewer app (creatively called "MatlabViewer"), which is
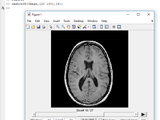
imshow3D:(3D imshow) Displays 3D images slice by slice.Intensity adjusting & slice browsing by mouse
imshow3D displays 3D grayscale or RGB images in a slice by slice fashion with mouse-based slice browsing and window and level adjustment control, and auto slice browsing control.Usage:imshow3D (
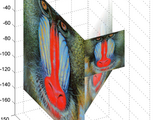
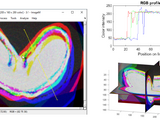
Plot images as 3D planes with full control over position and scale.
This function will display an image in a 3D plane with the specified position, image normal, image x direction and scale. It can display full colour and monochrome images with or without
A notable use case is to simulate RGB or Kinect (depth) camera images for computer vision applications.
3D Rendering Toolbox: Color images and depth maps from 3D meshesImplementation of the computer graphics pipeline for triangulated meshes, in addition to a number of camera plotting functions. Handles

This is the repository for the BioImage Suite Web Project
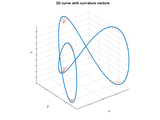
Calculates the local radius of curvature as well as the cumulative arc length and the curvature vector along a 1D curve in 2D or 3D space
Function circumcenter finds the radius R and the center of the circumscribed circle of a triangle in 3D space. Function curvature calls circumcenter for every triplet , , of neighboring points along
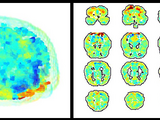
ASL Viewer visualize peak time map from 4D volume data (time-sequential 3D) of ASL (arterial spin labeling).
This app creates a peak time map and a maximum intensity map from a 4D NIfTI file of ASL (arterial spin labeling) imaging. They can be displayed as overlaid on the anatomical image (such as T1 or TOF
GUI for exploration of 3D images (stacks)
A graphical user interface for display and exploration of 3D images of various types. Manages grayscale, RGB, label images. Allows orthoslices display, isosurface reconstruction, changing intensity

Scrollable 3D viewer for complex MR-data (intensity = magnitude, color = phase)
The viewer has the option to scale the intensity to the magnitude data... 1) Linearly 2) Square rooted3) Log-scaled

Volume slice viewer
Export figure as U3D file or directly to 3D interactive graphics within PDF.
can be found here: http://www.ctan.org/tex-archive/macros/latex/contrib/media9For PDF readers which do not render 3D figures, it is possible to include an alternative 2D image as a substitute to the

Geometric computing library for 3D shapes: meshes, points, lines, planes...
The aim of geom3d library is to handle and visualize 3D geometric primitives such as points, lines, planes, polyhedra... It provides low-level functions for manipulating 3D geometric primitives
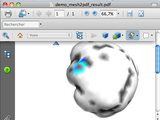
Export triangulated mesh into a pdf with a 3D interactive object.
Export triangulated mesh into a pdf with a 3D object. The matlab mesh is converted to IDTF with matlab code. The IDTF file is converted to u3d with an external binary file. The u3d file can then be
JAABA: The Janelia Automatic Animal Behavior Annotator
make_STL_of_Array Convert a voxelized object contained within a 3D logical array into an STL surface mesh, It's optimal for 3D printing.
make_STL_of_Array Convert a voxelized object contained within a 3D logical array into an STL surface mesh, It's optimal for 3D printing because of the number of faces in final STL is as low as
Open source ca imaging processing tools to aquire neural traces from 2 photon image sequences

Software for the analysis and interactive exploration of spectral imaging data such as mass spectrometry imaging and Raman spectroscopy
Equivalent ellipsoid from 3D image
ellipsoid is weighted by image intensity).The function "imEquivalentEllipsoid" computes moments of the 3D image or labels, and returns the associated equivalent 3D ellipsoid. The function is similar to that
imshow3Dfull displays 3D images slice by slice in 3 orthogonal views, with mouse control
imshow3Dfull is an extended version of imshow3D. It displays 3D grayscale or RGB images from three perpendicular views(i.e. axial, sagittal, and coronal) in slice by slice fashion with mouse based
Interactively move a 3D object anywhere in the 3D space with a mouse.
TDFig is an interactive matlab GUI. It displays a 3D objects in the traditional 4-view window (top, front, right and camera).It also allows users to grasp these objects and move them anywhere in the

Full application for analyzing MOLLI images for quantifying T1 of the heart muscle.
Full manual not available at this time. Enter application through batcher app that stores image information, preprocesses and opens images. Use viewer to draw annotations. Image analysis modules
3-d volume (voxel) rendering
An update to Joe Conti's popular vol3d function, allowing voxel colors and alpha values to be defined explicitly. Functionality is increased, but the function is entirely backwards compatible.In
Plots 3D polar data with axes.
Polar3D plots 3 dimensional data given angular and radial ranges. A choice of plot types and interpolation methods is supported by this function. Useful particularly in producing 3D plots sampled on
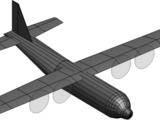
Draw a very simple 3D airplane and animate it too
The c130 function draws a simple 3D airplane modelled after the Lockheed C-130. The xyz2rpy function estimates roll, pitch, and yaw from given x,y,z coordinates. No special toolboxes required
Quickly and easily create 2d and 3d plots of fMRI data.
generating 2- or 3-dimensional plots of fMRI data that can be manipulated (e.g. rotated, modified) in real time.Although these tools may be used to produce publication-quality figures, the focus here is on
Exports 3d line elements into a DXF file for further use with CAD software.
Given a filename and a 3d line where each line element is specified by X,Y, and Z coordinates it writes a DXF file with the a connected line and N vertices.
You can also select a web site from the following list
Americas
- América Latina (Español)
- Canada (English)
- United States (English)
Europe
- Belgium (English)
- Denmark (English)
- Deutschland (Deutsch)
- España (Español)
- Finland (English)
- France (Français)
- Ireland (English)
- Italia (Italiano)
- Luxembourg (English)
- Netherlands (English)
- Norway (English)
- Österreich (Deutsch)
- Portugal (English)
- Sweden (English)
- Switzerland
- United Kingdom (English)
Asia Pacific
- Australia (English)
- India (English)
- New Zealand (English)
- 中国
- 日本Japanese (日本語)
- 한국Korean (한국어)