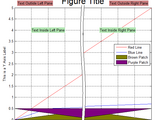
Splits the x-axis into 2 disjoint regions in order to hide an uninteresting portion of a figure.
of tick marks.6.) Obeys ‘Layer’ property7.) Works with semilogy plots and with either axis reversed8.) Can resize after splitting axis8.) Possible to unsplit axisLimitations1.) No support for semilogx
- 10.9K (All time)
- 18 (Last 30 days)
- 4.7 / 5
- Community
-
6 Aug 2013

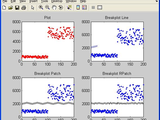
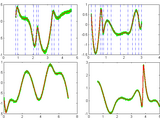
Produces a plot who's y-axis skips to avoid unecessary blank space.
BreakPlot(x,y,y_break_start,y_break_end,break_type)Produces a plot who's y-axis skips to avoid unecessary blank spaceINPUTxyy_break_starty_break_endbreak_type if break_type='RPatch' the plot will
- 15.6K (All time)
- 12 (Last 30 days)
- 4.6 / 5
- Community
-
1 Jul 2003
Splits the y axis hiding values within a given range
breakyaxis([minYvalue,maxYvalue])Splits the y axis into two separate regions to avoid unnecessary blank space. The split interval is determined by the y-axis values minYvalue and
- 16K (All time)
- 35 (Last 30 days)
- 4.5 / 5
- Community
-
6 Mar 2014
Breaks the Y-axis so that the x-axis will cross the y-axis at 0 and continues at any number
This routine just adds 2 yTicks at the bottom of the y-axis First added ytick will be assigned 0 Second y-tick are two almost horizontal lines to break up the y-axis
- 2.6K (All time)
- 3 (Last 30 days)
- 5.0 / 5
- Community
-
10 Dec 2008

truncAxis (break X/Y axis | 截断坐标轴)
Create broken axes by truncating X and/or Y axis, supporting logarithmic scaling and reversed axis and resizing the axes based on X/Y range.
Basic usagetruncAxis(gca, 'X', [x1, x2])truncAxis(gca, 'Y', [y1, y2])truncAxis(gca, 'X', [x1, x2], 'Y', [y1, y2]) Where:x1, x2: break points on X-axis, satisfying XLim(1) < x1 < x2 <
- 769 (All time)
- 22 (Last 30 days)
- 5.0 / 5
- Community
-
11 May 2026
Produces a plot who's y-axis skips to avoid unnecessary blank space
Produces a plot who's y-axis skips to avoid unecesary blank spaceReplaces BREAKAXIS
- 16.8K (All time)
- 10 (Last 30 days)
- 5.0 / 5
- Community
-
12 Nov 2008

Inserts < // > into a 'broken' or discontinuous x-axis.
h=BreakXAxis(x,y,start,stop,width) plots (x,y) and breaks the plot's x-axis between and , by inserting a broken-axis symbol < // > into a space wide. This type of plot is often used in
- 14.2K (All time)
- 29 (Last 30 days)
- 4.5 / 5
- Community
-
8 Jul 2003

Piecewise linear least square fit
Fit experimental data with linear piecewise continuos function with given x-axis break points.
Generates 1-D look-up table (LUT) optimal (least-square sense with continuity constraint) y-axis points from experimental (x,y) data given a vector of x-axis break points.Note that x-axis break
- 5.6K (All time)
- 3 (Last 30 days)
- 4.9 / 5
- Community
-
22 Mar 2013

Breaks the x or y axis.
MATLAB function to add an axis break to a plot.CAUTION: break is only aesthetic. Does not alter the plotted data.
- 3.1K (All time)
- 1 (Last 30 days)
- 3.7 / 5
- Community
-
21 Jun 2015

Root Locus Analysis and Parameter Calculation Tool
This MATLAB program performs plots, poles/zeros, asymptotes, Angle of Departure and Arrival, Imaginary Axis Crossing and break in/away point
asymptotes.Breakaway and Break-in Points: Determines points where roots diverge or converge on the real axis.Angle of Departure and Arrival: Calculates these angles for complex poles and zeros.Imaginary Axis Crossing
- 261 (All time)
- 6 (Last 30 days)
- 5.0 / 5
- Community
-
28 Dec 2024

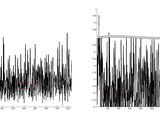
BreakAxisandZoom(xx,yy,startA,stopA,startErase_before,stopErase_after,width)
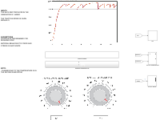
The function BreakAxisandZoom helps users to analyze a portion of high frequency periodic data.
The function BreakAxisandZoom helps users to analyze a part of high frequency periodic data by setting break points on X-axis of the plot by the user. For example, given a sinusoidal plot of very
- 33 (All time)
- 1 (Last 30 days)
- -- / 5
- Community
-
8 Apr 2017

breaking the x axis
breaking the x axis also you can convert it to break y axis, easly.a = .1:.01:10;b= sin(a);subplot(2,1,1);plot(a,b)graphic2 = gca;subplot(2,1,2);BreakXAxisv2(a',b',2,7,graphic2)
- 226 (All time)
- 1 (Last 30 days)
- 1.0 / 5
- Community
-
21 Sep 2018
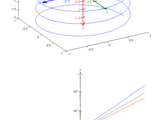
3D Rotation about Shifted Axis
Computes/applies rotation about arbitrary 3D line.
3xN matrix of transformed points, i.e., the input points rotated about the axis. All other input/output arguments have the same meanings as before.
- 6.7K (All time)
- 3 (Last 30 days)
- 5.0 / 5
- Community
-
4 Apr 2021

1D Shallow Water Equations Dam Break
Solves the 1D Shallow Water Equations for a Dam Break scenario
(James Adams) in 2014. Uses Dam Break conditions (initial water velocity is set to zero). A choice of either zero gradient (water flows out of the domain) or reflective boundary conditions is given.Plots
- 2.3K (All time)
- 9 (Last 30 days)
- 5.0 / 5
- Community
-
6 May 2014
oaxes - central axis lines through an origin
Draw central axis lines through an origin point.
Oaxes creates a set of axis lines through a specified origin point. Oaxes supports both 2D and 3D views, ticks and tick labels, axis labels, log-scaled axes, and has a plethora of properties
- 6K (All time)
- 1 (Last 30 days)
- 4.9 / 5
- Community
-
7 Aug 2012

Axis_Prunelabels -- clean up redundant axis labels
Minimizes redundant axis labels in a grid of subplots
AXIS_PRUNELABELS takes a figure with a grid of subplots (created using either SUBPLOT or custom AXES commands), and (a) forces all the subplots to have the same axis limits, and (b) turns off axis
- 2.1K (All time)
- 1 (Last 30 days)
- 4.5 / 5
- Community
-
1 Sep 2016
Zoom mode (h-axis, y-axis or both axis) set by mouse position
Switch between vertical/horizontal/both axis zoom mode by moving the mouse above the figure.
In a matlab figure, in order to switch between vertical axis zooming and horizontal axis zooming, the user must click on Tools/Option/..., or right-click on the figure and to chose the zoom mode
- 106 (All time)
- 4 (Last 30 days)
- 5.0 / 5
- Community
-
3 May 2017

Scanning timeseries for piecewise constant segments
according to Rissanen's Minimum Description Length Principle. [breaks, idealized_x, steplength, stepvalue, jumps] = scan_for_breaks(x, optional lmin)The input vector 'x' will be scanned for breakspoints using
- 240 (All time)
- 1 (Last 30 days)
- 5.0 / 5
- Community
-
15 May 2017

phymhan/matlab-axis-label-alignment
Align axis labels nicely in parallel with axes in MATLAB (3-D) plots.
This is a simple MATLAB function for axis label alignment. It still works when Projection mode is Perspective or when DataAspectRatio is not [1 1 1].## Functions- `align_axislabel`: it rotates $x
- 7.6K (All time)
- 6 (Last 30 days)
- 4.4 / 5
- Community
-
23 Dec 2017

samexaxis (nice subplots with same x axis)
Makes it alot easier to make nice figures with the same x axis.
subplots that have common x axises USAGE: samexaxis([optionalarguments]) Optional arguments: * YAxisLocation (default='left') : choose left,right, alternate or alternate2 * XAxisLocation
- 13.8K (All time)
- 1 (Last 30 days)
- 4.4 / 5
- Community
-
29 Mar 2005
Electrical breaking roller simulation using matlab
roller simulation on matlab
automatically breaks after reaching the limited speed(MORE NOTES ARE PROVIDED INSIDE MODEL)
- 48 (All time)
- 1 (Last 30 days)
- 5.0 / 5
- Community
-
13 Aug 2019
EMG functions and classification methods for prosthesis control - Joseph Betthauser
EMG DSP functions, classifiers, and miscellaneous
- 977 (All time)
- 6 (Last 30 days)
- 5.0 / 5
- Community
-
24 Jun 2018

XYrotalabel - rotate X-axis and Y-axis labels
Very simple reliable script giving simple control over label rotation with higher stability
- 1.9K (All time)
- 1 (Last 30 days)
- 5.0 / 5
- Community
-
12 Jan 2016
Rotate three-dimensional vector(s) about a specified axis by a specified angle.
This is a very simple program that implements Rodrigues's rotation formula. Inputs are arrays of three-dimensional column or row vectors that are to be rotated about a specified axis by a specified
- 2.4K (All time)
- 1 (Last 30 days)
- 5.0 / 5
- Community
-
3 Jan 2012

PECUZAL embedding algorithm for Matlab
This is the PECUZAL implementation for Matlab. An automated approach for attractor reconstruction of uni- and multivariate datasets.
- 138 (All time)
- 2 (Last 30 days)
- 5.0 / 5
- Community
-
14 Aug 2023

- 590 (All time)
- 1 (Last 30 days)
- 5.0 / 5
- Community
-
20 Jun 2024
- 11.4K (All time)
- 20 (Last 30 days)
- 4.9 / 5
- Community
-
1 Aug 2024

Joystick Adaptor 4 axis & Buttons
Access to the installed Joysticks from MATLAB.
The Joystick Adaptor 4 axis & Buttons is an upgrade of Roberto Waissman's Joystick Adaptor for two axis only. It allows access to installed joysticks in MS Windows operating systems based on NT
- 3.4K (All time)
- 1 (Last 30 days)
- 5.0 / 5
- Community
-
9 Nov 2005

- 2.8K (All time)
- 2 (Last 30 days)
- 4.9 / 5
- Community
-
11 Apr 2017
- 1.1K (All time)
- 2 (Last 30 days)
- 4.7 / 5
- Community
-
31 Jan 2017
GODLIKE - A robust single-& multi-objective optimizer
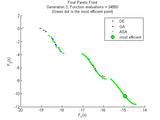
GODLIKE combines 4 global optimizers for both single/multi-objective optimizations
- 10.8K (All time)
- 4 (Last 30 days)
- 4.8 / 5
- Community
-
2 May 2020
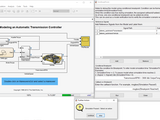
Two Methods for Breaking Data Dependency Loops in System Level Models
Methods for removing data dependencies with a minimum number of blocks
. This paper focuses on how to easily and systematically break these loops.Two methods are covered in this paper, using function-call subsystems and unit delay blocks. Both of these methods can be used to
- 1.3K (All time)
- 1 (Last 30 days)
- 5.0 / 5
- Community
-
1 Sep 2016

Returns the position of a plotted axis region
axis, which may differ from the actual axis position, depending on the axis limits, data aspect ratio, and plot box aspect ratio. The position is returned in the same units as the those used to define
- 5.3K (All time)
- 2 (Last 30 days)
- 4.9 / 5
- Community
-
23 Sep 2021
Set same axis limits to all currently open plots.
SAMEAXES unifies/synchronizes axis limits on different axes and subplots.
SAMEAXES unifies/synchronizes axis limits on different axes and subplots. Calling sameaxes() sets identical limits [the pooled min() and max()] to each axis respectively - which is very handy to
- 653 (All time)
- 1 (Last 30 days)
- 4.8 / 5
- Community
-
21 May 2014
- 4K (All time)
- 24 (Last 30 days)
- 5.0 / 5
- Community
-
15 Jul 2024
Break a string into multiple lines
The function linewrap.m wraps a single string into multiple lines by breaking it at word boundaries. The user can specify the desired maximum number of characters per line.
- 4.3K (All time)
- 1 (Last 30 days)
- 5.0 / 5
- Community
-
1 Sep 2016

Add multiple X or Y axes to plots, rescale data, use any function, add data tips, zoom, flexible.
This package will allow you to plot data on multiple X or Y axis. Similar to MATLAB's own plotyy function, but less limiting. Features: Create any combination of X or Y axes, plot multiple lines on
- 2.2K (All time)
- 2 (Last 30 days)
- 3.7 / 5
- Community
-
9 Dec 2015

Collocation-based spectral-element toolbox
Functions and example codes for a collocation spectral-element scheme (Chebyshev or Legendre)
- 2.2K (All time)
- 2 (Last 30 days)
- 5.0 / 5
- Community
-
1 Apr 2013

Adds a 'Wavenumber (cm^{-1})' axis on top of current graph where the the x-axis is in nm or µm.
ha2=addinvcmaxis(DecPlaces,Unit,ha)Adds a 'Wavenumber (cm^{-1})' axis on top of current graph where the the x-axis is in nm or µm. The xlabel should be specified with unit before running addinvcmaxis
- 182 (All time)
- 2 (Last 30 days)
- 4.0 / 5
- Community
-
24 Sep 2015

The shortest distance(orthogonal distance) from a point to Ellipsoid or Hyperboloid
Standart Hyperboloid equation centered at the origin Parameters: * X, [x y z] - A point Cartesian coordinates data, n x 3 matrix or three n x 1 vectors * axis,[a; b; c] - ellipsoid radii [a; b
- 581 (All time)
- 2 (Last 30 days)
- 5.0 / 5
- Community
-
8 Jul 2017

Draw two figures with separate x and y axis
This script plots two sets of 1D data on the same figure.
This script plots two sets of 1D data on the same figure with two separate axis and with the same gridding. The code also checks if the x-axis data are the same, if the x-axis dataare not the same
- 668 (All time)
- 1 (Last 30 days)
- 5.0 / 5
- Community
-
24 Jun 2011
- 6.1K (All time)
- 7 (Last 30 days)
- 4.9 / 5
- Community
-
23 Mar 2024

Add top X-axis with different scale
Add an X-axis on top (additional to the one on bottom) of the figure, with its own ticks labels ...
Add an X-axis on top (additional to the one on bottom) of the figure, with its own ticks labels and axis label (allow double scale).Ticks, minor ticks positions and x limits are set to be identical
- 11.6K (All time)
- 3 (Last 30 days)
- 4.5 / 5
- Community
-
29 Nov 2005
Separating Axis theorem - MATLAB implementation
Used to find if two quadrilaterals intersect
The Separating Axis Theorem (SAT) is used to check if two oriented bounding boxes intersect. This can be used in collision detection or checking for bounding box intersection in pattern recognition
- 617 (All time)
- 1 (Last 30 days)
- 5.0 / 5
- Community
-
30 Aug 2012

Multiple Rapidly-exploring Random Tree (RRT)
Multiple RRT implementation for mobile robot path planning or C-space manipulator motion planning
% See Usage section in RrtPlanner.m file. This is a basic example of usage:treesMax = 28; %How many multiple trees (must be at least 2, 1 for source and 1 for destinationseedsPerAxis = 3; %Number of
- 7.2K (All time)
- 1 (Last 30 days)
- 5.0 / 5
- Community
-
31 Oct 2013
Break up a RINEX GPS file by a length of time
TIMESPLITRINEX splits a RINEX GPS file by time. TIMESPLIT(FILENAME,t) breaks a RINEX file into shorter files of length t in seconds. Useful for breaking a large file into days, or a day file into
- 2.9K (All time)
- 2 (Last 30 days)
- 5.0 / 5
- Community
-
30 Jul 2007
Major Axis Regression (Principal Axis Regression).
research and controversy are continuing and definitive recommendations are difficult to make. In Sokal and Rohlf (1981, 2nd ed.), the numerical result for major axis regression for the example data set is
- 611 (All time)
- 1 (Last 30 days)
- 5.0 / 5
- Community
-
17 Jun 2010
Two-axis CNC RC cutting machine
Yet another demo for my students.
A similar story to http://www.mathworks.com/matlabcentral/fileexchange/62474-2-axis-cnc-ilc-cutting-machine, but this time using multiresonant / multioscillatory (MOSC) controllers.
- 598 (All time)
- 3 (Last 30 days)
- 5.0 / 5
- Community
-
10 Aug 2017

Break the given Chocolate Bar with minimum number of breaks.
Assume you have a chocolate bar consisting, as usual, of a number of squares arranged in a rectangular pattern. Your task is to split the bar into small squares (always breaking along the lines
- 896 (All time)
- 1 (Last 30 days)
- -- / 5
- Community
-
28 Oct 2009
LBM codes for population balance equations
Codes implementing lattice Boltzmann method for solving population balance equations
- 1.3K (All time)
- 2 (Last 30 days)
- 4.5 / 5
- Community
-
3 Jun 2015

- 29.8K (All time)
- 17 (Last 30 days)
- 4.8 / 5
- Community
-
23 May 2016
- 4.1K (All time)
- 3 (Last 30 days)
- 5.0 / 5
- Community
-
29 May 2008
Use HTML jargon for multi axis layout.
- 29.2K (All time)
- 8 (Last 30 days)
- 4.8 / 5
- Community
-
9 Jul 2014
- 9.4K (All time)
- 2 (Last 30 days)
- 4.9 / 5
- Community
-
29 May 2008
Classical_Mechanics_with_Matlab_applications_JEH.zip
Applications from the text: Classical Mechanics with Matlab applications by Javier E Hasbun, Jones &
- 3.4K (All time)
- 4 (Last 30 days)
- 5.0 / 5
- Community
-
15 Jul 2008

POV-Lab - Matlab interface to POV-Ray
Extends Matlab's visualisations with external raytracer - POV-Ray.
- 70 (All time)
- 1 (Last 30 days)
- 5.0 / 5
- Community
-
25 Dec 2023
Name: SimBreakpoint Tool Helpful for setting conditional breakpoints in a given model for debugging purpose.
- 188 (All time)
- 1 (Last 30 days)
- 5.0 / 5
- Community
-
25 Mar 2022

Compute the medial axis of 2-D solids whose boundary is made-up of line segments and circular arcs.
The attached Matlab routines compute the medial axis of 2-D solids whose boundary is made-up of line segments and circular arcs. Caveats:* The attached code is slow. * There are also a few bugs that
- 3.4K (All time)
- 3 (Last 30 days)
- 4.0 / 5
- Community
-
26 Sep 2006
Chebfun V4 - old version; please download current version instead
Numerical computation with functions
- 14K (All time)
- 2 (Last 30 days)
- 4.8 / 5
- Community
-
29 Oct 2015

Add breaks in the bar plot
This code is derived from BreakAxis matlab file. Basically it adds a 'scale' parameter to reduce the bar sizes in a bar plot. Higher values of scale will reduce the 'tall bars' more.
- 3K (All time)
- 3 (Last 30 days)
- 1.8 / 5
- Community
-
19 Mar 2007