
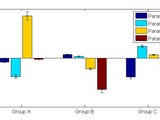
Generate a bar plot with multiple stacks grouped together.
Plot a set of stacked bars, but group them according to labels provided.Params: stackData is a 3D matrix (i.e., stackData(i, j, k) => (Group, Stack, StackElement)) groupLabels is a CELL
- 12.5K (All time)
- 10 (Last 30 days)
- 4.8 / 5
- Community
-
13 Sep 2011

pierremegevand/errorbar_groups
ERRORBAR_GROUPS produces customizable grouped bar plots with overlaid error bars.
At its most basic, this function produces bar plots similar to those obtained using MATLAB's BAR(Y,'grouped') function call, and then overlays error bars onto the corresponding bars. ERRORBAR_GROUPS
- 7.8K (All time)
- 2 (Last 30 days)
- 4.1 / 5
- Community
-
20 Sep 2017

barweb (BARgraph With Error Bars)
Plots a fully customizable grouped bar graph with error bars
barweb.m calls the BAR and ERRORBAR MATLAB functions to produce bar graphs with error bars. The resultant graph is fully customizable, from group naming to legend inclusion to colormap setting. It
- 39.1K (All time)
- 4 (Last 30 days)
- 4.7 / 5
- Community
-
1 Oct 2009

dabarplot - beautiful grouped and stacked bar plots
Bar plots for multiple conditions and groups (part of a larger toolbox for 2-level factorial data)
significance but on effect size. Using stacked bars and adding number values on top of them can be particularly effective in conveying effect sizes among conditions or among groups.The examples below illustrate
- 385 (All time)
- 8 (Last 30 days)
- 5.0 / 5
- Community
-
16 Jul 2024
Management of data tables, similar to dataframe in R, with enhanced plotting facilities.
Explorer window* Type "MatStats" in the search bar, and select the MatStats library. * Click the "Add" button to add the library to your local configuration### Manual installationTo install the toolbox
- 2.6K (All time)
- 11 (Last 30 days)
- 5.0 / 5
- Community
-
29 Feb 2024
Create Healthy Looking Error Bars
Plots nice error bars as the default. Can also top group plots with error bars.
2*E(i) long. If Y and E are a matrices, errob groups the bars produced by the elementsin each row and plots the error bars in their appropriate place above the bars.errorb(X,Y,E) plots Y versus X with
- 6.6K (All time)
- 1 (Last 30 days)
- 5.0 / 5
- Community
-
20 Oct 2011

Change the color of a bar to same groups have the same color.
SETCOLOR_BARBYGROUP change the color of a bar to same groups have the same color.SETCOLOR_BARBYGROUP(COLOR) change the color of a bar with N groups where the i-th group has the COLOR(i, :) color
- 266 (All time)
- 1 (Last 30 days)
- 5.0 / 5
- Community
-
23 Dec 2011

barwebpairs (pair bars within groups and between groups)
Add pairing brackets to a bar plot (e.g. to indicate statically significant differences)
fit the brackets4. To only include within group pairings set pairsBG = []5. Within group brackets are plotted first. Each bracket is plotted at the minimum y-value (above bars and errorbars between the
- 1.6K (All time)
- 1 (Last 30 days)
- 4.0 / 5
- Community
-
5 May 2010

Boxplots for multiple conditions and groups (part of a larger toolbox for 2-level factorial data)
significance but on effect size. Using stacked bars and adding number values on top of them can be particularly effective in conveying effect sizes among conditions or among groups.The examples below illustrate
- 1.5K (All time)
- 14 (Last 30 days)
- 4.6 / 5
- Community
-
3 Jun 2024

- 22 (All time)
- 4 (Last 30 days)
- -- / 5
- Community
-
8 Nov 2023

E-Fi - an LTE and WiFi coexistence mechanism
E-Fi (Evasive Wi-Fi) main code - an LTE and WiFi coexistence mechanism in the Unlicensed band
- 599 (All time)
- 2 (Last 30 days)
- -- / 5
- Community
-
20 Jun 2018

groups categorical data in a bar chart
and category combination. This output can be easy graphed using a bar chart. The output is organized in a way the grouping comes first followed by the category which makes difference between the groups
- 174 (All time)
- 1 (Last 30 days)
- -- / 5
- Community
-
24 Jul 2014

Group ICA/IVA software (MATLAB)
under grant 1RO1EB000840 to Dr. Vince Calhoun and Dr. Tulay Adali. It is a MATLAB toolbox which implements multiple algorithms for independentcomponent analysis and blind source separation of group (and
- 114 (All time)
- 5 (Last 30 days)
- -- / 5
- Community
-
21 Feb 2024

Plots a bar graph with 2 y axes including errorbars
plots a 2 axis bar plot by normalizing values to be from 0 to 1 on both data sets, plotting them as one grouped bargraph, adding 2nd y-axis and then modfying y axis ticks. bar1 & bar2 are column
- 2.8K (All time)
- 1 (Last 30 days)
- -- / 5
- Community
-
24 Apr 2006
Threshold crossing deletion: deletes (makes nan) all bar the max value for every group of consecutive values over a threshold.
the group are deleted (made nan)%% Inputs:% var - data for the calculation% threshold - threshold to calculate groups from%% Outputs:% var_tcd - variable with group data deleted bar the max values
- 1 (All time)
- 1 (Last 30 days)
- -- / 5
- Community
-
15 Apr 2024

- 233 (All time)
- 1 (Last 30 days)
- -- / 5
- Community
-
27 Oct 2014

Groups of bars, stacked to a different grouping
Groups of bars that are stacked according to a grouping variable, as opposed to the y-axis.
% twogroup_stacked_bar - plots a bar of a grouped variable that is also stacked by a different grouping%% Inputs:% var - data for binning% bins - the bin edges, where bins(1) is the left edge of
- 3 (All time)
- 1 (Last 30 days)
- -- / 5
- Community
-
15 Apr 2024

Four Bar Linkage Optimization in Simscape
Four-bar linkage lengths are optimized using MATLAB to follow a desired trajectory.
This example shows a four-bar linkage modeled in Simscape Multibody that is optimized using MATLAB so that the tip of the linkage follows a desired trajectory.Mechanical designers often wish to
- 2.3K (All time)
- 12 (Last 30 days)
- 5.0 / 5
- Community
-
18 May 2026

Control with ease the relative position and color of every bar, bar group, and offset in your bar chart.
height of the plot, the aspect ratio, bar offset (spacing between individual bars in groups), bar group offset (spacing between groups of bars), x-limit offset (space between data and plot extents on
- 468 (All time)
- 1 (Last 30 days)
- -- / 5
- Community
-
23 May 2020

Group boxplots together along the x-axis with space between groups.
x = {rand(100,2), rand(20, 2), rand(150,2)}; boxplotGroup(x)The lines above will create two groups of three boxplot boxes per group, with space separating the groups. You can control the amount of
- 6.5K (All time)
- 21 (Last 30 days)
- 4.9 / 5
- Community
-
27 Apr 2021
Tools for Processing Consecutive Repetitions in Vectors
A set of functions for labeling and manipulating groups of consecutively repeating elements in a vector.
This FEX submission provides some functions that are similar to MATLAB's usual findgroups() and splitapply() commands, except that they are specifically well-suited to scenarios where the groups are
- 157 (All time)
- 3 (Last 30 days)
- 5.0 / 5
- Community
-
25 Jan 2023

Plot Groups of Stacked Bars with second y-axis
Plot Groups of Stacked Bars with second y-axis
This is an extension to https://de.mathworks.com/matlabcentral/fileexchange/32884-plot-groups-of-stacked-bars?s_tid=srchtitle by Evan (https://de.mathworks.com/matlabcentral/profile/authors/807971)
- 131 (All time)
- 1 (Last 30 days)
- -- / 5
- Community
-
17 Dec 2021

undecorateFig - remove/restore figure border and title bar
Removes/restores the border and title bar of legacy (Java-based) Matlab figures
Description:undecorateFig removes the border, title bar, menu bar and toolbar of a legacy (Java-based) Matlab figure.redecorateFig restores the figure to its previous (decorated
- 1.8K (All time)
- 2 (Last 30 days)
- 5.0 / 5
- Community
-
8 Apr 2026

This function creates a TEXT progress bar in your command window.
This function creates a text progress bar to show progress of your script in the command window. It should be called with a STRING argument to initialize and terminate. Otherwise the number
- 7.2K (All time)
- 9 (Last 30 days)
- 5.0 / 5
- Community
-
29 Jun 2010
This is a very simple extension of MatLab's bar function to add error bars.
- 27.1K (All time)
- 3 (Last 30 days)
- 4.9 / 5
- Community
-
3 Jun 2018

Creates an attractive shaded error region rather than discrete bars.
shadedErrorBar shadedErrorBar is a MATLAB function that creates a continuous shaded error region around a line rather than discrete bars.The error region can either be specified explicitly or
- 47.8K (All time)
- 89 (Last 30 days)
- 4.9 / 5
- Community
-
6 Feb 2024

Adjust error bars width in an errorbar plot to a ratio of the x-axis or a length (x-axis units).
function errorbar_tick(h,w,xtype)ERRORBAR_TICK Adjust the width of errorbarsERRORBAR_TICK(H) adjust the width of error bars with handle H. Error bars width is given as a ratio of X axis lenght
- 12.8K (All time)
- 3 (Last 30 days)
- 4.9 / 5
- Community
-
6 Feb 2009

Merging a bar chart with a map
Seamlessly merge a bar chart with a map to display geographically-coded categorical variables
Let us break down the example code that calls the bar_chart function:Data Loading:The code begins by loading data from a file named dataexample.Data Description:The following variables are
- 41 (All time)
- 1 (Last 30 days)
- 5.0 / 5
- Community
-
16 May 2024

BARPATCH | Highly customizable bar graph w/error bars
Create and customize a bar graph with error bars. Supports grouped data.
This function will create a grouped bar graph with error bars without using the standard plotting functions BAR and ERRORBAR. It uses PATCH to create the bars and LINE to construct the error bars
- 536 (All time)
- 1 (Last 30 days)
- -- / 5
- Community
-
14 Dec 2015

This code plots bars with errorbars, as simple as that.
, this function provides the handles to the BAR and ERRORBAR lines for further modification.[b,e] = errorbarbar(y,e); % or ...[b,e] = errorbarbar(x,y,e); % where x is center location of the group of
- 5.1K (All time)
- 2 (Last 30 days)
- 4.6 / 5
- Community
-
22 Jun 2011

Sets a figure's docking group container
setFigDockGroup sets a figure's (or list of figures') docking group container, enabling to dock figures to containers other than the default 'Figures' container (for example, to the 'Editor' group as
- 5.6K (All time)
- 1 (Last 30 days)
- 5.0 / 5
- Community
-
9 Dec 2020

treeTable - create a sortable table control with collapsible row groups
Create a sortable Java-based tree-table GUI control having collapsible/expandable data row groups
, ColumnTypes, ColumnEditable, Groupable, InteractiveGrouping (see internal help section for details)Output parameters: htable - handle to Java tree-table objectImportant features: * Table is fully sortable
- 2.5K (All time)
- 5 (Last 30 days)
- 5.0 / 5
- Community
-
6 Aug 2013

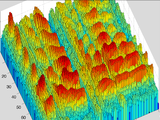
This function makes a 3D bar plot with error bars
give the function two matrices, on matrix with bar peak heights, the other matrix with error bar lengths.See the commented section in the function code for example code to test it withbased on code
- 1K (All time)
- 2 (Last 30 days)
- 4.0 / 5
- Community
-
18 Oct 2011
3D bar plot with arbitrary coloring
This function creates a 3D bar plot with arbitrary coloring for each individual bar from an MxN matrix. Bar heights = elements of the matrixBar colors = (1) user-specified colormap or (2) MxNx3 array
- 1K (All time)
- 2 (Last 30 days)
- 5.0 / 5
- Community
-
17 Mar 2014
Plotting TP/FN Bar Chart from Confusion Matrix
This code provides an alternative view of confusion matrix data by plotting as a bar chart.
This function will produce a bar plot to show the true positives (TP) versus the false negative (FN) for each target class. Both correct and incorrect classifications are color-coded to show the
- 16 (All time)
- 1 (Last 30 days)
- -- / 5
- Community
-
20 Aug 2023

Create Menu Bar (s) on any location in a figure window
This function MenuBar, allows the user to create menu's anywhere in a figure it replaces UIcontextmenu of UIpanels by real menu bars. menubar(figure_handle) or menubar Mouse hover, and
- 2.1K (All time)
- 1 (Last 30 days)
- 5.0 / 5
- Community
-
12 Jan 2011
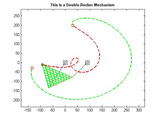
Four Bar Linkage (All configurations)
Animate Any Four Bar Linkage configuration
Plot Any Four Bar Linkage configuration including: Double-Crank, Rocker-Crank, Double-Rocker and Change Point. Keep pressing on the ENTER key when prompted by the code. To better visualize the
- 7.1K (All time)
- 4 (Last 30 days)
- 5.0 / 5
- Community
-
26 Jul 2011
Creates a 3-D bar chart where bars are placed in user specified X-Y locations.
SCATTERBAR3(X,Y,Z,WIDTH) draws 3-D bars of height Z at locations X and Y with width WIDTH. X, Y and Z must be of equal size. If they are vectors, than bars are placed in the same fashion as the
- 9K (All time)
- 2 (Last 30 days)
- 4.6 / 5
- Community
-
1 Sep 2016

Attractive and full-featured progress bars.
Progress bars can be used to track long-running matlab programs where alternatives (e.g. displaying progress information in the console) are infeasible.Progress bars can be group in windows, and
- 2.4K (All time)
- 2 (Last 30 days)
- 4.8 / 5
- Community
-
17 Aug 2010

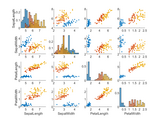
pairplot(meas, label, group, colors, mode)
plot pairwise relationships in matrix
group= Fisher(:,1); colors = lines(length(unique(group))); figure; pairplot(Fisher(:,2:size(Fisher,2)), {'PW', 'PL', 'SW', 'SL'}, num2cell(num2str(group)), colors, 'bar'), ylabel('Probability') figure
- 1.2K (All time)
- 3 (Last 30 days)
- 4.7 / 5
- Community
-
28 Feb 2020

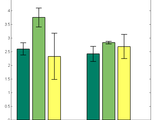
Plots Bar plots of Data with corresponding errorbars.
[1 1 1 1 1 1 1 1 1 1 ; 2 2 2 2 2 2 2 2 2 2];[hBars,hError] = BarsWithError(Y,YError,YError,'random',{'Group 1','Group 2'},'Sample Bar Chart')Neatly plots Bar plots with corresponding errorbars which
- 1.9K (All time)
- 1 (Last 30 days)
- 4.6 / 5
- Community
-
6 Sep 2005
A simple text/console progress bar for the builtin ODE solvers
If you're like me and have to run some ODE solvers in remote computers via telnet/ssh, you will find this simple output function very handy.It just prints a progress bar in the console according to
- 1.4K (All time)
- 1 (Last 30 days)
- 4.4 / 5
- Community
-
19 Aug 2010

Simple wrapper to bar allowing you to specify bar colors and labels.
Quite frequently you want to color the bars in a bar chart according to your own scheme - e.g. to highlight an anomalous measurement in red. The bar function doesn't make it easy to do this, but
- 1.1K (All time)
- 1 (Last 30 days)
- 5.0 / 5
- Community
-
29 Nov 2014

Move a barplot's base value.
An M-file to move the base value for bar and hist plots from 0 to any value. Especially useful for log-scale bar plots.
- 4.7K (All time)
- 1 (Last 30 days)
- 5.0 / 5
- Community
-
1 Sep 2016

barvalues(h, precision, textParams)
Display bar values on-top of bars in a bar or histogram plot .
matlab-barvaluesa matlab function for displaying values atop bars in barplots (and similar plots).
- 1.7K (All time)
- 2 (Last 30 days)
- 4.6 / 5
- Community
-
20 Dec 2021
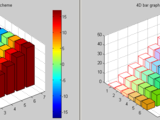
4-D bar graph : hack on bar3 with another dimension via color (2 poss. schemes)
bar4viacolor - 4-D bar graph : bar3 with another dimension via bar color. Two color schemes are available: The jet colormap and another that, likebar3, is a column group scheme whose groups colors
- 3.1K (All time)
- 1 (Last 30 days)
- 4.4 / 5
- Community
-
1 Jun 2006

Add significance bars and asterisks to various plot types
available. sigstar makes it easy to add lines and significance asterisks joining one or more pairs of groups on bar charts, box plots, and even line plots. The user simply supplies the identities of the two
- 10K (All time)
- 25 (Last 30 days)
- 4.7 / 5
- Community
-
14 Jul 2024

ODE Progress Bar and Interrupt
ODE integration progress bar, interrupt control and estimated time to completion
This program displays a progress bar indicating where the ode integrator is in the specified time scale. The program allows the premature termination of an integration without loss of data
- 2.2K (All time)
- 4 (Last 30 days)
- 4.8 / 5
- Community
-
19 May 2006

Error bar plot with filled area curves.
- 7.1K (All time)
- 10 (Last 30 days)
- 4.8 / 5
- Community
-
9 Oct 2018
Analyze and Visualize Earthquake Data in Python with Matplot
Analyze and Visualize Earthquake Data in Python with Matplotlib
- 13 (All time)
- 1 (Last 30 days)
- -- / 5
- Community
-
23 Aug 2024
Progress monitor (progress bar) that works with parfor
Displays the percentage of parfor iterations which have completed.
- 11.5K (All time)
- 14 (Last 30 days)
- 4.8 / 5
- Community
-
25 Oct 2011
Can flip the order of the legend of a stacked bar plot.
Can flip the order of the legend of a stacked bar plot, to make it appear in the same order as the stacked pieces themselves.
- 490 (All time)
- 1 (Last 30 days)
- 5.0 / 5
- Community
-
24 Apr 2018
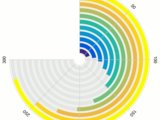
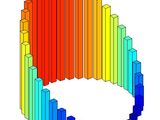
Bar graph plotted on polar coordinate system
radialBar creates a bar graph on polar coordinate system. It could be considered as a mix between "polar" and "bar" functions.See demo provided in the zip file.
- 232 (All time)
- 1 (Last 30 days)
- 5.0 / 5
- Community
-
23 Feb 2017

Container objects to manage radio or toggle buttons with functionality of the GUI Layout Toolbox
The ButtonGroup controls require the GUI Layout Toolbox by Ben Tordoff and DavidSampson available at:http://www.mathworks.com/matlabcentral/fileexchange/27758-gui-layout-toolbox The controls in this
- 1.3K (All time)
- 1 (Last 30 days)
- 4.0 / 5
- Community
-
21 Jun 2011

hatched bar chart (阴影/条纹填充柱状图)
function for hatched bar chart, horizontal hatched bar chart, stacked hatched bar chart. (need at least R2017b)
Basic usagey = [2 2 3 2 5; 2 5 6 2 5; 9 8 9 2 5];% Create hatched bar chart objectHB = hatchedBar(y, 'HatchType',{'/','\','.','_','x'}, 'Horizontal','off');% Draw hatched bar chartHB = HB.draw
- 494 (All time)
- 11 (Last 30 days)
- 5.0 / 5
- Community
-
14 Apr 2026
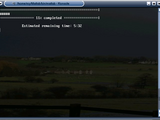
An ASCII progress bar with timers.
This is a relatively powerful ASCII progress bar with indicators of time.It works under Windows and Linux.
- 6K (All time)
- 2 (Last 30 days)
- 4.6 / 5
- Community
-
25 Apr 2016

Draw a progress bar in ASCII mode without clear the command window
This program allows you to draw a progress bar containing the percentage of completion, the number of iterations made, the number of total iterations and the approximate remaining time.The main file
- 1.2K (All time)
- 1 (Last 30 days)
- 5.0 / 5
- Community
-
20 Jul 2005
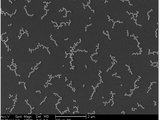
PICT: Particle Image Characterization Tool
Quantitative image analysis tool for characterizing structural properties of nanoparticle clusters
- 835 (All time)
- 3 (Last 30 days)
- 5.0 / 5
- Community
-
29 Jan 2015

Bar plot with whiskers and significance bridges
Produces a bar plot with whiskers above each bar and bridges between user-specified bars
This file allows for the creation of bar and whisker plots with significant/insignificant relations indicated between bars by bridges plotted above the whiskers. It takes three arguments: the height
- 559 (All time)
- 1 (Last 30 days)
- 5.0 / 5
- Community
-
4 Apr 2012

PARFOR progress monitor (progress bar) v4
Progress monitor for matlab parfor (parallel) loops with estimation of the remaining time
(___, 'showWorkerProgress', true) will displaythe progress of all workers (default: false).ppm = ParforProgressbar(___, 'progressBarUpdatePeriod', 1.5) willupdate the progressbar every 1.5 second (default: 1.0 seconds).ppm =
- 4.5K (All time)
- 32 (Last 30 days)
- 4.8 / 5
- Community
-
5 Sep 2019