
This function makes a 3D bar plot with error bars
from: http://illigal.blogspot.com/2005/01/matlab-script-for-3d-bar-plot-with.html
- 1K (All time)
- 2 (Last 30 days)
- 4.0 / 5
- Community
-
18 Oct 2011
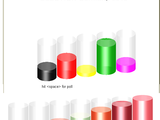
3D bar plot with arbitrary coloring
This function creates a 3D bar plot with arbitrary coloring for each individual bar from an MxN matrix. Bar heights = elements of the matrixBar colors = (1) user-specified colormap or (2) MxNx3 array
- 1K (All time)
- 2 (Last 30 days)
- 5.0 / 5
- Community
-
17 Mar 2014

MATLAB Plot Gallery - Bar Graph 3D
Create a 3D bar chart
This is an example of how to create a 3D bar chart in MATLAB®.Read about the "bar3" function in the MATLAB documentation.For more examples, go to MATLAB Plot Gallery -
- 5.2K (All time)
- 2 (Last 30 days)
- -- / 5
- Community
-
19 Dec 2018
Creates a 3-D bar chart where bars are placed in user specified X-Y locations.
SCATTERBAR3(X,Y,Z,WIDTH) draws 3-D bars of height Z at locations X and Y with width WIDTH. X, Y and Z must be of equal size. If they are vectors, than bars are placed in the same fashion as the
- 9K (All time)
- 4 (Last 30 days)
- 4.6 / 5
- Community
-
1 Sep 2016

- 10 (All time)
- 1 (Last 30 days)
- -- / 5
- Community
-
12 Sep 2024
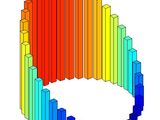
function to plot 'election-like' 3d bars
function to plot election-like 3d bars. hp=votebar(high,val,colo,randomVote) INPUT: high: absolute height of the bars (1 value) val: a vector of N-values to plot colo: a 2D-matrix of N x
- 738 (All time)
- 1 (Last 30 days)
- 4.0 / 5
- Community
-
9 May 2010

A function to create 3d bar plot with the ability to set X and Y values.
BAR3D 3-D bar plot.BAR3D(X,Y,Z) plots the 3d bars defined by X, Y and Z, where X and Y are m by n matrices which can be generated by meshgrid from vectors, and Z is an m by n by p matrix. If p is
- 239 (All time)
- 2 (Last 30 days)
- -- / 5
- Community
-
13 Dec 2021

A simple 3D bar plot that allows for irregular spacing along either the x- or y-dimension.
Neither "bar3" nor "hist3" allow for columns that have changing widths from one row to the next; "bar3d" does. I use it to plot two-dimensional discrete distributions on an irregular grid.
- 47 (All time)
- 1 (Last 30 days)
- -- / 5
- Community
-
22 Aug 2019

Matrix Analysis of Three Dimensional Bar Structures MABS3D
This program is an extension of MABS2D to three-dimensional space (3D).
Input data is the Microsoft Excel® file, where the table of nodes, table of elements, nodal external loads vector and boundary conditions are stored. After running the mabs3d.m file on the Command
- 3.1K (All time)
- 2 (Last 30 days)
- 5.0 / 5
- Community
-
2 May 2010

Error bar on 3D plot. Plot x- y- and z- direction error bars.
- 705 (All time)
- 2 (Last 30 days)
- -- / 5
- Community
-
26 Oct 2010

- 199 (All time)
- 1 (Last 30 days)
- -- / 5
- Community
-
12 Jul 2016

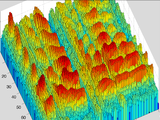
Plots the sparsity pattern of the matrix S in a 3D domain with matrix entries represented as bars that are colored according to its height.
SPY3D(S) plots the sparsity pattern of the matrix S in a three-dimensional (3D) domain with matrix entries represented as bars that are colored according to their value (height) and using a colorbar.
- 84 (All time)
- 2 (Last 30 days)
- -- / 5
- Community
-
5 Feb 2019

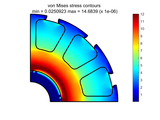
FEA of 1D Bar using three node element
Implementation of 1D Bar FEA Algorithm with visualization of displacement and stress contours.
Implementation of 1D Bar FEA Algorithm with visualization of displacement and stress contours.
- 1.1K (All time)
- 1 (Last 30 days)
- 5.0 / 5
- Community
-
27 Apr 2019

Simple bar plot with errorbars in 3D
Simple bar plot with errorbars in 3D.
This is not 3-dimensional bar plot, but 2D bars with errorbars in 3D. See the screenshot.Lower part of errorbars may not shown properly. In that case, adjust the view point a little bit. Or if you
- 1.3K (All time)
- 1 (Last 30 days)
- -- / 5
- Community
-
19 Jun 2009
4-D bar graph : hack on bar3 with another dimension via color (2 poss. schemes)
do not have to be in the structure for their defaults to take effect) Z - 3D data just like bar3 where each element yields a bar. ColorScaleData - Same size as Z. Defines the 4D data. Note
- 3.1K (All time)
- 1 (Last 30 days)
- 4.4 / 5
- Community
-
1 Jun 2006

LESM - Linear Elements Structure Model
LESM is a graphical-interactive program for structural analysis of 2D and 3D models composed of linear elements, such as bars and beams.
LESM is a graphical-interactive program for structural analysis of models composed of linear elements, i.e. uniaxial elements with one dimension much larger than the others, such as bars (axial
- 802 (All time)
- 6 (Last 30 days)
- 5.0 / 5
- Community
-
22 May 2022

- 1 (All time)
- 1 (Last 30 days)
- -- / 5
- Community
-
12 Sep 2024

plot_bar3_colorheights( x, y, Z )
3D Barplot with height of the bars coded into the color
3D Barplot with height of the bars coded into the color. Might be used as a 2D Histogram.- x and y are the centers of the bins- Z is a matrix containing the heights of the bins
- 423 (All time)
- 1 (Last 30 days)
- 5.0 / 5
- Community
-
10 Jul 2015

BarChartRace with 3D effect
BarChartRace3DIt is all about data and it is all about presentation. BarChartRace is a popular way to visualize change of data over time. To further impress your audiences, a 3D BarchartRace can help
- 33 (All time)
- 1 (Last 30 days)
- -- / 5
- Community
-
28 Jul 2021
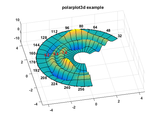
Plots 3d polar data with polar axis and polar grid
peaks(x,y); % peaks function on a polar grid % draw 3d polar plot figure('Color','white','NumberTitle','off','Name','PolarPlot3d
- 25.7K (All time)
- 9 (Last 30 days)
- 4.9 / 5
- Community
-
4 Mar 2016
- 905 (All time)
- 7 (Last 30 days)
- 5.0 / 5
- Community
-
20 May 2023
3D Rotation about Shifted Axis
Computes/applies rotation about arbitrary 3D line.
Generates the roto-translation matrix for the rotation around an arbitrary line in 3D. The line need not pass through the origin. Optionally, also, applies this transformation to a list of 3D
- 6.7K (All time)
- 1 (Last 30 days)
- 5.0 / 5
- Community
-
4 Apr 2021
Color Tools for MATLAB is an experimental collection of MATLAB functions related to color science computation and visualization.
- 1.1K (All time)
- 7 (Last 30 days)
- 5.0 / 5
- Community
-
27 Jan 2023

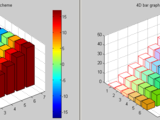
3-D bar graph with dark (or custom) plot background
Plot 3-D bar graph with dark (or custom) plot background, selected color scheme and annotations.
- 40 (All time)
- 1 (Last 30 days)
- 5.0 / 5
- Community
-
29 Oct 2023
- 118 (All time)
- 4 (Last 30 days)
- 5.0 / 5
- Community
-
30 Nov 2018
- 763 (All time)
- 2 (Last 30 days)
- 5.0 / 5
- Community
-
2 Oct 2019
3D Rendering Toolbox: Color image and depth map from mesh
A notable use case is to simulate RGB or Kinect (depth) camera images for computer vision applications.
3D Rendering Toolbox: Color images and depth maps from 3D meshesImplementation of the computer graphics pipeline for triangulated meshes, in addition to a number of camera plotting functions. Handles
- 214 (All time)
- 2 (Last 30 days)
- 5.0 / 5
- Community
-
12 Mar 2024
Plot images as 3D planes with full control over position and scale.
This function will display an image in a 3D plane with the specified position, image normal, image x direction and scale. It can display full colour and monochrome images with or without
- 2.7K (All time)
- 2 (Last 30 days)
- 5.0 / 5
- Community
-
12 Feb 2013

Matlab function that displays a progression bar in the command window.
cmdWaitBarMatlab function that displays a progression bar in the command window.This Matlab function will generate an updating progress bar (waitbar) in the command window.This is a useful tool
- 30 (All time)
- 2 (Last 30 days)
- 5.0 / 5
- Community
-
23 Jan 2023

WITio: A MATLAB data evaluation toolbox to script broader insights into big data from WITec microscopes
- 702 (All time)
- 19 (Last 30 days)
- 5.0 / 5
- Community
-
22 Aug 2024

StiffMa: Fast finite element STIFFness MAtrix generation in MATLAB by using GPU computing.
thermal conduction phenomenon and a vector problem represented by the structural elasticity are considered in a three-dimensional (3D) domain. Unstructured meshes with 8-node hexahedral elements are used to
- 188 (All time)
- 1 (Last 30 days)
- -- / 5
- Community
-
14 Aug 2023
A Search Algorithm for Engineering Optimization
These codes present various examples of engineering optimization and tuning the controllers’ gain.
- 233 (All time)
- 2 (Last 30 days)
- 5.0 / 5
- Community
-
30 Jun 2022
MIP, Color, Slice and Shaded 3D (shearwarp) Volume Rendering, interactive 3D view/measurement GUI
kind of renders. The fast render algorithm which renders a 3D volume to a 2D image, is based on a Matlab coded implementation of the Shear-Warp transform, in which instead of rotating the viewer rays the
- 56.9K (All time)
- 10 (Last 30 days)
- 4.8 / 5
- Community
-
15 Sep 2016

Optimization Benchmark Truss Problems
MATLAB codes for modeling and analysis of the benchmark optimization problems
MATLAB codes for modeling and analysis of three benchmark structural optimization problems are provided in this submission. These benchmark truss problems (10-bar truss, 25-bar truss, and 72-bar
- 1.1K (All time)
- 8 (Last 30 days)
- 5.0 / 5
- Community
-
27 May 2020
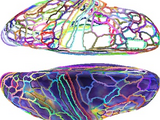
Microscopy Image Browser (MIB)
MIB is a package for segmentation of multi-dimensional (2D-4D) microscopy datasets
- 1.3K (All time)
- 5 (Last 30 days)
- 5.0 / 5
- Community
-
9 Feb 2019
Linear Direct Stiffness Method
An educational code which performs basic linear direct stiffness method using bar elements in 2D or 3D.
triangulation structures. This imposes some limitiations on nodal connectivity but allows for easy data handling and plotting.The solver LDS_Solver.m works equally well with 2D and 3D triangulations. Users can
- 141 (All time)
- 4 (Last 30 days)
- -- / 5
- Community
-
6 Jun 2022

A set of educational and visualization scripts to help engineering students learn and internalize FEM concepts.
- 190 (All time)
- 2 (Last 30 days)
- 5.0 / 5
- Community
-
18 Sep 2021
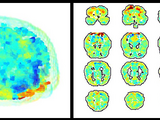
Quickly and easily create 2d and 3d plots of fMRI data.
generating 2- or 3-dimensional plots of fMRI data that can be manipulated (e.g. rotated, modified) in real time.Although these tools may be used to produce publication-quality figures, the focus here is on
- 2.9K (All time)
- 1 (Last 30 days)
- 5.0 / 5
- Community
-
17 Jan 2017
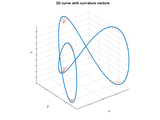
Curvature of a 1D curve in a 2D or 3D space
Calculates the local radius of curvature as well as the cumulative arc length and the curvature vector along a 1D curve in 2D or 3D space
Function circumcenter finds the radius R and the center of the circumscribed circle of a triangle in 3D space. Function curvature calls circumcenter for every triplet , , of neighboring points along
- 5.7K (All time)
- 5 (Last 30 days)
- 4.8 / 5
- Community
-
10 Nov 2021
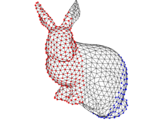
Equivalent ellipsoid from 3D image
ellipsoid is weighted by image intensity).The function "imEquivalentEllipsoid" computes moments of the 3D image or labels, and returns the associated equivalent 3D ellipsoid. The function is similar to that
- 1.5K (All time)
- 1 (Last 30 days)
- 5.0 / 5
- Community
-
28 Aug 2019
Make STL of 3D array (Optimal for 3d printing)
make_STL_of_Array Convert a voxelized object contained within a 3D logical array into an STL surface mesh, It's optimal for 3D printing.
make_STL_of_Array Convert a voxelized object contained within a 3D logical array into an STL surface mesh, It's optimal for 3D printing because of the number of faces in final STL is as low as
- 2.4K (All time)
- 5 (Last 30 days)
- 4.9 / 5
- Community
-
13 Sep 2018

livescript2markdown: MATLAB's live scripts to markdown
MATLAB's live scripts to markdown. The provided function converts your latex (generated from a live script) to markdown so that it could eas
- 574 (All time)
- 3 (Last 30 days)
- 5.0 / 5
- Community
-
15 Sep 2023
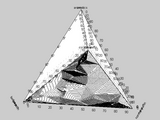
This is the 3D update ternplot of "GTL jetfuel_ternplot with neural network".
This is the 3D update of "GTL jetfuel_ternplot with neural network". "main_3D.m" code plots relationship between four chemical compositions of GTL (normal-paraffin, iso-paraffin, cyclo-paraffin and
- 701 (All time)
- 1 (Last 30 days)
- 5.0 / 5
- Community
-
24 Sep 2012

Grid search sensitivity-based PSO (GSSPSO)
Practical optimization of truss using grid search sensitivity-based PSO.
- 120 (All time)
- 1 (Last 30 days)
- 5.0 / 5
- Community
-
21 Oct 2023
3D rotation of 3D image
This function rotates a 3D image based on angle and axis to rotate a round to.interpolation methods include: nearest neighbor and linear interpolation. The rest of the image that is out of bound is
- 1.3K (All time)
- 1 (Last 30 days)
- 5.0 / 5
- Community
-
18 Feb 2014
Move a 3D object with mouse in a traditional 4-view window
Interactively move a 3D object anywhere in the 3D space with a mouse.
TDFig is an interactive matlab GUI. It displays a 3D objects in the traditional 4-view window (top, front, right and camera).It also allows users to grasp these objects and move them anywhere in the
- 2.1K (All time)
- 1 (Last 30 days)
- 5.0 / 5
- Community
-
12 Nov 2010
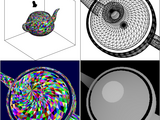
Plots 3D polar data with axes.
Polar3D plots 3 dimensional data given angular and radial ranges. A choice of plot types and interpolation methods is supported by this function. Useful particularly in producing 3D plots sampled on
- 20.6K (All time)
- 1 (Last 30 days)
- 4.8 / 5
- Community
-
8 Mar 2006

3D extension of phantom.m
A 3D extension of MATLAB's phantom function - generates a phantom consisting of an arbitrary number of ellipsoids in 3D.
- 10.5K (All time)
- 9 (Last 30 days)
- 4.4 / 5
- Community
-
20 Sep 2006
Sequential Linear Programming (SLP) with Trust Region (TR) and Sequential Quadratic Programming (SQP) with Line Search or TR Strategy
- 3.1K (All time)
- 4 (Last 30 days)
- 4.6 / 5
- Community
-
11 Oct 2020

Examples of 3D curves described in Chapter 7 of the book: "CRC Standard Curves and Surfaces"
- 2.1K (All time)
- 2 (Last 30 days)
- 5.0 / 5
- Community
-
30 Aug 2009
Allows you to write 3D arrays to Excel
xlswrite is limited to writing 2D arrays to Excel. This is a simple function that allows you to write 3D arrays to Excel.
- 1.8K (All time)
- 1 (Last 30 days)
- 5.0 / 5
- Community
-
31 Mar 2008

3D Grid Lines Generation with Matlab
Generate 3D grid lines along X, Y and Z dimensions for better visualization of multidimensional plots.
The present code is a Matlab function that provides a generation of 3D grid lines (along X, Y and Z dimensions) for better visualization of 3D, 4D, 5D or 6D plots created by the Matlab functions
- 871 (All time)
- 3 (Last 30 days)
- 4.8 / 5
- Community
-
28 Jun 2022
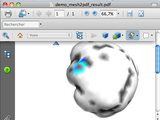
Matlab mesh to PDF with 3D interactive object
Export triangulated mesh into a pdf with a 3D interactive object.
Export triangulated mesh into a pdf with a 3D object. The matlab mesh is converted to IDTF with matlab code. The IDTF file is converted to u3d with an external binary file. The u3d file can then be
- 10K (All time)
- 3 (Last 30 days)
- 4.6 / 5
- Community
-
10 Jan 2010
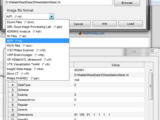
GUI to open most Medical file-formats: Dicom, V3D, ISI, NifTI, Analyze and other formats
This function ReadData3D allows the user to open medical 3D files. It supports the following formats : Dicom Files ( .dcm , .dicom ) V3D Philips Scanner ( .v3d ) GIPL Guys Image Processing
- 32.7K (All time)
- 12 (Last 30 days)
- 4.2 / 5
- Community
-
23 Feb 2011
dxf export for 3d line elements
Exports 3d line elements into a DXF file for further use with CAD software.
Given a filename and a 3d line where each line element is specified by X,Y, and Z coordinates it writes a DXF file with the a connected line and N vertices.
- 8.9K (All time)
- 1 (Last 30 days)
- 4.9 / 5
- Community
-
13 May 2004

Generate a bar plot with multiple stacks grouped together.
Plot a set of stacked bars, but group them according to labels provided.Params: stackData is a 3D matrix (i.e., stackData(i, j, k) => (Group, Stack, StackElement)) groupLabels is a CELL
- 12.6K (All time)
- 10 (Last 30 days)
- 4.8 / 5
- Community
-
13 Sep 2011

Interactive viewer of 3 orthogonal slices of 3D volume.
Simple interactive viewer of 3 orthogonal slices of 3D volume and of sequence of volumes. The interaction is performed by mouse left button or keyboard arrows.
- 6.3K (All time)
- 5 (Last 30 days)
- 4.5 / 5
- Community
-
21 Jul 2011
Export figure to 3D interactive PDF
Export figure as U3D file or directly to 3D interactive graphics within PDF.
can be found here: http://www.ctan.org/tex-archive/macros/latex/contrib/media9For PDF readers which do not render 3D figures, it is possible to include an alternative 2D image as a substitute to the
- 10.8K (All time)
- 7 (Last 30 days)
- 4.2 / 5
- Community
-
4 Aug 2021

- 3.4K (All time)
- 2 (Last 30 days)
- 5.0 / 5
- Community
-
28 Jul 2010

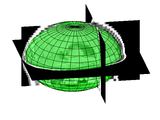
Example of creating a 3D textured Earth globe
Example of creating a 3D textured Earth globe.
- 9.6K (All time)
- 7 (Last 30 days)
- 4.8 / 5
- Community
-
16 Oct 2013