
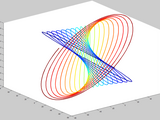
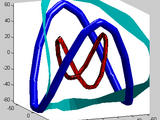
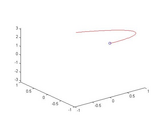
Plot 3D lines with CData, (actually surface)
plots a 3-D "line" with c-data as color Makes a surface object and the colouring is controlled by the colormap.Example:v_start = [2 1 8]; % m/sg = 9.81; % m/(s^2)t_impact = 2*v_start(3)/g; % st =
- 4.2K (All time)
- 2 (Last 30 days)
- 4.8 / 5
- Community
-
22 Oct 2009

Draw a colored line in 2D or 3D
z-valuescdata (opt.): vector with color-data2 input arguments => cdata = y; z=0 3 input arguments => cdata = z 4 i.a. & z = [] => cdata = y; z=0 OUPUT=====h: Handle to line
- 6.5K (All time)
- 1 (Last 30 days)
- 4.8 / 5
- Community
-
16 Apr 2007
colormapline - color-changing 2D or 3D line
Plot a 2D or 3D line using a specified colormap.
% H = colormapline(X,Y,Z,C) Plot a line using a specified colormap% If Z is given, a 3D plot with coordinates X, Y, Z is created.% If Z is not given, a 2D plot of Y over X if created.% If Y and
- 1.9K (All time)
- 1 (Last 30 days)
- 5.0 / 5
- Community
-
14 Dec 2016

Plots a 3D line with color encoding along the length using the patch function.
This function plots a 3D line (x,y,z) encoded with scalar color data (c). This function is an improvement over the CLINE function previously made available on TMW File Exchange. Rather than using
- 6.9K (All time)
- 1 (Last 30 days)
- 3.9 / 5
- Community
-
31 Mar 2016

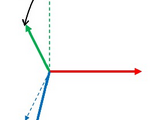
Plot a colored 3 D line changing its color with distance in the space.
This function plot a colored 3-dimensional line of a set of given points. The plot varies its color in a form, x axis as red, y as green and z axis as blue. So basically if the plot proceeds in
- 314 (All time)
- 1 (Last 30 days)
- -- / 5
- Community
-
19 Sep 2011
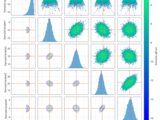
MATDRAM: Delayed-Rejection Adaptive Metropolis MCMC
MatDRAM is a pure-MATLAB Adaptive Markov Chain Monte Carlo simulation and visualization library.
- 558 (All time)
- 2 (Last 30 days)
- 5.0 / 5
- Community
-
16 Jul 2024

3D Rotation about Shifted Axis
Computes/applies rotation about arbitrary 3D line.
Generates the roto-translation matrix for the rotation around an arbitrary line in 3D. The line need not pass through the origin. Optionally, also, applies this transformation to a list of 3D
- 6.7K (All time)
- 1 (Last 30 days)
- 5.0 / 5
- Community
-
4 Apr 2021
dxf export for 3d line elements
Exports 3d line elements into a DXF file for further use with CAD software.
Given a filename and a 3d line where each line element is specified by X,Y, and Z coordinates it writes a DXF file with the a connected line and N vertices.
- 8.9K (All time)
- 1 (Last 30 days)
- 4.9 / 5
- Community
-
13 May 2004

- 698 (All time)
- 1 (Last 30 days)
- 5.0 / 5
- Community
-
11 Mar 2022
Like plot3, but will plot a real (round, flat, triangle, squared) thick shaded 3D line
This function works like plot3, but will display a real 3D round (vessel like), flat, triangle or squared line. Which can be shaded, because the surface is a triangulated patch.
- 3.5K (All time)
- 2 (Last 30 days)
- 5.0 / 5
- Community
-
19 Aug 2008
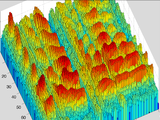
3D bar plot with arbitrary coloring
This function creates a 3D bar plot with arbitrary coloring for each individual bar from an MxN matrix. Bar heights = elements of the matrixBar colors = (1) user-specified colormap or (2) MxNx3 array
- 1K (All time)
- 2 (Last 30 days)
- 5.0 / 5
- Community
-
17 Mar 2014
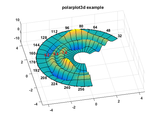
Plots 3d polar data with polar axis and polar grid
peaks(x,y); % peaks function on a polar grid % draw 3d polar plot figure('Color','white','NumberTitle','off','Name','PolarPlot3d
- 25.7K (All time)
- 9 (Last 30 days)
- 4.9 / 5
- Community
-
4 Mar 2016

MATLAB Plot Gallery - Line Plot 3D
Create a 3D plot
This is an example of how to create a 3D plot in MATLAB®.Read about the "plot3" function in the MATLAB documentation.For more examples, go to MATLAB Plot Gallery -
- 4.4K (All time)
- 2 (Last 30 days)
- 4.0 / 5
- Community
-
19 Dec 2018
3D Rendering Toolbox: Color image and depth map from mesh
A notable use case is to simulate RGB or Kinect (depth) camera images for computer vision applications.
3D Rendering Toolbox: Color images and depth maps from 3D meshesImplementation of the computer graphics pipeline for triangulated meshes, in addition to a number of camera plotting functions. Handles
- 214 (All time)
- 2 (Last 30 days)
- 5.0 / 5
- Community
-
12 Mar 2024
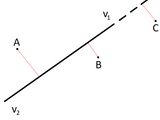
calculate the distance between a 2D or 3D line and one or more points
You can input either a 2D or a 3D line and 2D or 3D points. This function is an extended version of the line below, with some input checking:distance=norm(cross(v1-v2,pt-v2))/norm(v1-v2)Licence: CC
- 2.4K (All time)
- 3 (Last 30 days)
- 4.8 / 5
- Community
-
5 Jul 2020
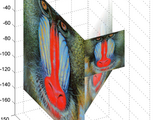
Plot images as 3D planes with full control over position and scale.
This function will display an image in a 3D plane with the specified position, image normal, image x direction and scale. It can display full colour and monochrome images with or without
- 2.7K (All time)
- 2 (Last 30 days)
- 5.0 / 5
- Community
-
12 Feb 2013
- 416 (All time)
- 1 (Last 30 days)
- -- / 5
- Community
-
17 Jul 2024
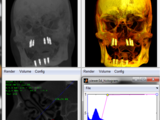
MIP, Color, Slice and Shaded 3D (shearwarp) Volume Rendering, interactive 3D view/measurement GUI
kind of renders. The fast render algorithm which renders a 3D volume to a 2D image, is based on a Matlab coded implementation of the Shear-Warp transform, in which instead of rotating the viewer rays the
- 56.9K (All time)
- 10 (Last 30 days)
- 4.8 / 5
- Community
-
15 Sep 2016

Plotting of colored 3D arrows based on patch command
This function allows plotting of colored 3D arrows by generating patchdata (faces “F”, vertices “V” and color data “C”). The patch data whichallows plotting of 3D quiver arrows with specified (e.g
- 1.6K (All time)
- 2 (Last 30 days)
- 5.0 / 5
- Community
-
28 Apr 2015
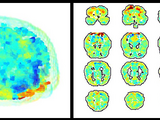
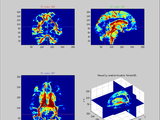
Quickly and easily create 2d and 3d plots of fMRI data.
generating 2- or 3-dimensional plots of fMRI data that can be manipulated (e.g. rotated, modified) in real time.Although these tools may be used to produce publication-quality figures, the focus here is on
- 2.9K (All time)
- 1 (Last 30 days)
- 5.0 / 5
- Community
-
17 Jan 2017
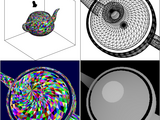
3D volume viz with interactive slice selection, colored ortho-planes, windowing, colormap selection.
This tool provides an interactive 3D volume visualization. The function accepts as arguments any 3D matrix (of type double or uint8) and optional colormap, and displays a 2x2 figure of the 3
- 7.2K (All time)
- 2 (Last 30 days)
- 4.6 / 5
- Community
-
23 Apr 2013
Equivalent ellipsoid from 3D image
ellipsoid is weighted by image intensity).The function "imEquivalentEllipsoid" computes moments of the 3D image or labels, and returns the associated equivalent 3D ellipsoid. The function is similar to that
- 1.5K (All time)
- 1 (Last 30 days)
- 5.0 / 5
- Community
-
28 Aug 2019

3D Bresenham's line generation
Generate X Y Z coordinates of a 3D Bresenham's line between two given points
This program will generate the coordinates of a 3D Bresenham's raster line between two given points.A very useful application of this algorithm can be found in the implementation of Fischer
- 3.5K (All time)
- 2 (Last 30 days)
- 4.5 / 5
- Community
-
22 Aug 2008
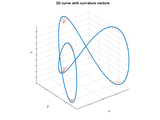
Curvature of a 1D curve in a 2D or 3D space
Calculates the local radius of curvature as well as the cumulative arc length and the curvature vector along a 1D curve in 2D or 3D space
Function circumcenter finds the radius R and the center of the circumscribed circle of a triangle in 3D space. Function curvature calls circumcenter for every triplet , , of neighboring points along
- 5.7K (All time)
- 5 (Last 30 days)
- 4.8 / 5
- Community
-
10 Nov 2021
Make STL of 3D array (Optimal for 3d printing)
make_STL_of_Array Convert a voxelized object contained within a 3D logical array into an STL surface mesh, It's optimal for 3D printing.
make_STL_of_Array Convert a voxelized object contained within a 3D logical array into an STL surface mesh, It's optimal for 3D printing because of the number of faces in final STL is as low as
- 2.4K (All time)
- 5 (Last 30 days)
- 4.9 / 5
- Community
-
13 Sep 2018
Plot lines with CData, (actually surface)
plots a 2-D "line" with c-data as colorMakes a surface object and the colouring is controlled by the colormap.Examples: x = 0:0.1:2*pi;color_line(x,sin(x),sin(x))color_line(x,cos(x),cos(x),'*')
- 4.2K (All time)
- 3 (Last 30 days)
- 4.3 / 5
- Community
-
7 Apr 2008

CIAtah (i.e. calciumImagingAnalysis)
CIAtah is a software package for calcium imaging analysis of one- and two-photon imaging datasets. https://github.com/bahanonu/ciatah
- 588 (All time)
- 3 (Last 30 days)
- -- / 5
- Community
-
24 Jul 2024

cprintf - display formatted colored text in Command Window
Displays sprintf-formatted strings in the Command Window using the specified color/underline/bold style
RGB color format (range: 0.0-1.0) [26, 178, 76] - numeric RGB values (range: 0-255) '#1ab34d' - Hexadecimal format (range: '00'-'FF', case insensitive). 3-digit HTML format also
- 29.8K (All time)
- 62 (Last 30 days)
- 4.9 / 5
- Community
-
26 Jun 2026

Conditionally colored line plot
Plots (2D line) graph split into two colors above and below a given threshold value
string that PLOT accepts (eg 'rx:' for a red dotted line with cross markers).The plotting follows the standard MATLAB PLOT approach of linearly interpolating between data values. The coloring/linestyle
- 1.7K (All time)
- 1 (Last 30 days)
- 3.8 / 5
- Community
-
3 Mar 2020
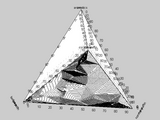
This is the 3D update ternplot of "GTL jetfuel_ternplot with neural network".
This is the 3D update of "GTL jetfuel_ternplot with neural network". "main_3D.m" code plots relationship between four chemical compositions of GTL (normal-paraffin, iso-paraffin, cyclo-paraffin and
- 701 (All time)
- 1 (Last 30 days)
- 5.0 / 5
- Community
-
24 Sep 2012

3D Grid Lines Generation with Matlab
Generate 3D grid lines along X, Y and Z dimensions for better visualization of multidimensional plots.
The present code is a Matlab function that provides a generation of 3D grid lines (along X, Y and Z dimensions) for better visualization of 3D, 4D, 5D or 6D plots created by the Matlab functions
- 871 (All time)
- 3 (Last 30 days)
- 4.8 / 5
- Community
-
28 Jun 2022
3D rotation of 3D image
This function rotates a 3D image based on angle and axis to rotate a round to.interpolation methods include: nearest neighbor and linear interpolation. The rest of the image that is out of bound is
- 1.3K (All time)
- 1 (Last 30 days)
- 5.0 / 5
- Community
-
18 Feb 2014
Plots 3D polar data with axes.
Polar3D plots 3 dimensional data given angular and radial ranges. A choice of plot types and interpolation methods is supported by this function. Useful particularly in producing 3D plots sampled on
- 20.6K (All time)
- 1 (Last 30 days)
- 4.8 / 5
- Community
-
8 Mar 2006
Move a 3D object with mouse in a traditional 4-view window
Interactively move a 3D object anywhere in the 3D space with a mouse.
TDFig is an interactive matlab GUI. It displays a 3D objects in the traditional 4-view window (top, front, right and camera).It also allows users to grasp these objects and move them anywhere in the
- 2.1K (All time)
- 1 (Last 30 days)
- 5.0 / 5
- Community
-
12 Nov 2010

3D extension of phantom.m
A 3D extension of MATLAB's phantom function - generates a phantom consisting of an arbitrary number of ellipsoids in 3D.
- 10.5K (All time)
- 9 (Last 30 days)
- 4.4 / 5
- Community
-
20 Sep 2006

Examples of 3D curves described in Chapter 7 of the book: "CRC Standard Curves and Surfaces"
- 2.1K (All time)
- 2 (Last 30 days)
- 5.0 / 5
- Community
-
30 Aug 2009
Allows you to write 3D arrays to Excel
xlswrite is limited to writing 2D arrays to Excel. This is a simple function that allows you to write 3D arrays to Excel.
- 1.8K (All time)
- 1 (Last 30 days)
- 5.0 / 5
- Community
-
31 Mar 2008
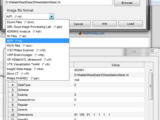
GUI to open most Medical file-formats: Dicom, V3D, ISI, NifTI, Analyze and other formats
This function ReadData3D allows the user to open medical 3D files. It supports the following formats : Dicom Files ( .dcm , .dicom ) V3D Philips Scanner ( .v3d ) GIPL Guys Image Processing
- 32.7K (All time)
- 11 (Last 30 days)
- 4.2 / 5
- Community
-
23 Feb 2011
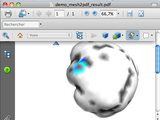
Matlab mesh to PDF with 3D interactive object
Export triangulated mesh into a pdf with a 3D interactive object.
Export triangulated mesh into a pdf with a 3D object. The matlab mesh is converted to IDTF with matlab code. The IDTF file is converted to u3d with an external binary file. The u3d file can then be
- 10K (All time)
- 3 (Last 30 days)
- 4.6 / 5
- Community
-
10 Jan 2010
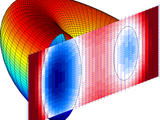
Export figure to 3D interactive PDF
Export figure as U3D file or directly to 3D interactive graphics within PDF.
figure directly to a PDF containing only an interactive 3D graphics object.Graphics object supported for export include: line, surface, patch, quivergroup, contourgroup.Line colors and marker styles
- 10.8K (All time)
- 6 (Last 30 days)
- 4.2 / 5
- Community
-
4 Aug 2021

Interactive viewer of 3 orthogonal slices of 3D volume.
Simple interactive viewer of 3 orthogonal slices of 3D volume and of sequence of volumes. The interaction is performed by mouse left button or keyboard arrows.
- 6.3K (All time)
- 5 (Last 30 days)
- 4.5 / 5
- Community
-
21 Jul 2011

- 3.4K (All time)
- 1 (Last 30 days)
- 5.0 / 5
- Community
-
28 Jul 2010
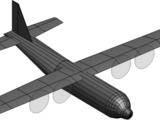
Draw a very simple 3D airplane and animate it too
The c130 function draws a simple 3D airplane modelled after the Lockheed C-130. The xyz2rpy function estimates roll, pitch, and yaw from given x,y,z coordinates. No special toolboxes required
- 4.1K (All time)
- 5 (Last 30 days)
- 4.8 / 5
- Community
-
4 Mar 2016

Geometric computing library for 3D shapes: meshes, points, lines, planes...
The aim of geom3d library is to handle and visualize 3D geometric primitives such as points, lines, planes, polyhedra... It provides low-level functions for manipulating 3D geometric primitives
- 43.5K (All time)
- 9 (Last 30 days)
- 4.9 / 5
- Community
-
28 Feb 2022

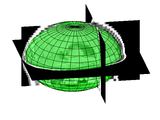
Example of creating a 3D textured Earth globe
Example of creating a 3D textured Earth globe.
- 9.6K (All time)
- 4 (Last 30 days)
- 4.8 / 5
- Community
-
16 Oct 2013
3D Space Coordinate Transformations
# 3d-coordinate-transformations3D Space Coordinate Transformations for Robotics Applications[
Allows modification of LineSpec and plots 3D vertex sets in 3D
Hybrid version of Giuseppe De Marco's gplot which allows modification of LineSpec and Robert Piche's gplot which plots 3D vertex data in 3D.I am using it to visualise flows through 3D capillary
- 1.4K (All time)
- 1 (Last 30 days)
- 5.0 / 5
- Community
-
29 Nov 2006

Produces a 3D scatterplot of XYZ data with varying colors
A 3D scatter plot of a Cartesian data set is drawn. The data points are sorted by color and plot3 is called once for each group of points that map to the same color. This reduces execution time
- 21.7K (All time)
- 1 (Last 30 days)
- 4.9 / 5
- Community
-
25 Dec 2014

Matlab 3D figure to 3D (X)HTML
Converts 3D objects of a Matlab figure to XHTML embedded X3D file. Interactive 3D website graphics.
DOM Library (Instant 3D the HTML way! http://www.x3dom.org/). Currently the function supports: Axes, Patch, Line, Surface, Text, Images and Light Objects.Note: Even volume rendering in your browser is possible
- 4.1K (All time)
- 6 (Last 30 days)
- 4.2 / 5
- Community
-
17 Aug 2011
3D Quiver with volumized arrows
Produce a 3D quiver of arrows with many visualization options
This quiver3D differs from the basic quiver3 in that it allows far more options for visualization. Based on the 'surf' command, you can produce color-based visuals of your data via the multiple
- 4K (All time)
- 3 (Last 30 days)
- 5.0 / 5
- Community
-
18 Sep 2006
RaspberryPi + MATLAB based 3D Scanner
A Simple Single Camera 3D scanner using a line LASER
This project implements a simple 3D scanner using the Raspberry Pi, Pi Camera and a line LASER. The algorithm is still a work in progress but gives a decent scan output. I am still working on
- 1.4K (All time)
- 3 (Last 30 days)
- 5.0 / 5
- Community
-
1 Sep 2016
3D Comet Plot with user specified tail length and line/marker configuration
Similar to the MATLAB routine comet3. It takes x, y, and z line data and creates a comet plot. The user can control the tail length, playback speed (frequency), and all the usual line parameters as
- 1.5K (All time)
- 1 (Last 30 days)
- 5.0 / 5
- Community
-
25 Sep 2013

- 833 (All time)
- 2 (Last 30 days)
- 5.0 / 5
- Community
-
5 Sep 2020

Creates 3D-histogram from an RGB image in the form of balls within the RGB cube
Takes RGB images in 24 bpp and computes the 3D histogram of such an image. I.e., splits every axis into 'n' bins thus making n^3 bins in total and shows the result in the form of 'bubbles' of
- 2.5K (All time)
- 1 (Last 30 days)
- 4.9 / 5
- Community
-
22 Oct 2012
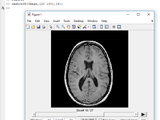
imshow3D:(3D imshow) Displays 3D images slice by slice.Intensity adjusting & slice browsing by mouse
imshow3D displays 3D grayscale or RGB images in a slice by slice fashion with mouse-based slice browsing and window and level adjustment control, and auto slice browsing control.Usage:imshow3D (
- 18.5K (All time)
- 22 (Last 30 days)
- 4.9 / 5
- Community
-
29 Oct 2018
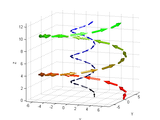
Plots a 3D line with color encoding along the length.
This function plots a 3D line (x,y,z) encoded with scalar color data (c) using the specified colormap (default=jet). Thus, lines with variable color can be plotted (eg. temperature along a 3D line
- 5.9K (All time)
- 2 (Last 30 days)
- 5.0 / 5
- Community
-
23 Jul 2003

3D Plot on a Spherical Surface
Plots 3D data on a sphere.
SPHERE3D plots 3D data on a spherical surface. Useful particularly in metrology of spherical surfaces, spherical wavefronts and
- 11.4K (All time)
- 2 (Last 30 days)
- 4.8 / 5
- Community
-
30 Sep 2005
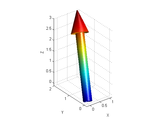
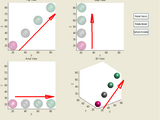
3D Arrow with many color/parameter options
Create a single 3D arrow in a volumized format
data using phong shading and MATLAB's lighting options.Example: arrow3D([0,0,0], [0,0,1],'red',0.82);%% Creates a single arrow starting at the origin with magnitude=1 along the z-axis, in red, with an
- 5.2K (All time)
- 4 (Last 30 days)
- 4.7 / 5
- Community
-
18 Sep 2006

Plotting a 3D array using a patch surface mesh
Plot a 3D array using patch=========================== Adam H. Aitkenhead adam.aitkenhead@christie.nhs.uk The Christie NHS Foundation Trust 17th August 2010 USAGE ===== This function enables a 3D
- 5K (All time)
- 2 (Last 30 days)
- 5.0 / 5
- Community
-
10 Feb 2012
Voxelized volume visualization for 3D and 3D RGB arrays
VOXview is an easy-to-use function for visualizing small 3D scalar or RGB (i.e. MxNxO x3) arrays. This function was specifically designed to give the user independent control of voxel alpha
- 550 (All time)
- 4 (Last 30 days)
- 5.0 / 5
- Community
-
26 Mar 2021