3,155 results

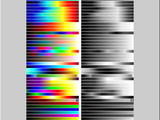
Use the cubehelix algorithm to generate colormaps suitable for grayscale conversion
Exchange](https://www.mathworks.com/matlabcentral/images/matlab-file-exchange.svg)](https://www.mathworks.com/matlabcentral/fileexchange/43700)[](https://matlab.mathworks.com/open/github/v1?repo=DrosteEffect/CubeHelix)CUBEHELIX generates colormaps
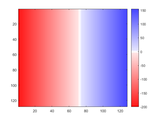
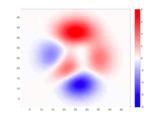
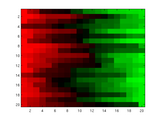
A colormap generator to display positive values as blue and negative values as red. Zero is displayed as either white or black.
Generates a RED-BLUE colormap with zero as white or black. Positive values are displayed as blue intensities and negative values are displayed as red intensities. Zero can be selected to be either

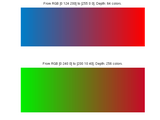
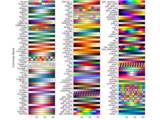
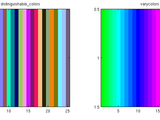
Generate maximally-distinct colors in an RGB colormap.
MAXDISTCOLOR generates an RGB colormap of maximally-distinct colors. The distance between the colors is measured in a perceptually uniform colorspace, which by default is OKLab
Creates a colormap using two boundary colors and one center color
, upload to current figure using: colormap(gca,newColormapName). Please see function text (comments) for further description and example usage. Very simple colormap generator, but please let me know if any
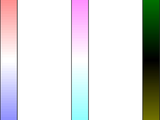
COLORGRADIENT allows you to generate a linear color gradient from color A to color B.
User can generate a custom linear colormap giving 2 colors and colormap depth.Colors are given as vectors with RGB values. The suggested input method is using intensity values for each channel (0,1
A Monotonic and Linear Grayscale Intensity Colormap with an Increased Contrast
High Contrast Parula-like Colormap GeneratorAuthor: Yong Hoon Lee (http://yonghoonlee.com, ylee196@illinois.edu)This is a monotonic and linear grayscale intensity colormap with an increased contrast

Sound Field Synthesis Toolbox for Matlab/Octave, see http://matlab.sfstoolbox.org
200 colormaps
An adjustable multiple-colour gradient colour map generator / editor for MATLAB, with presets.
This script allows you to generate a colour scale (as for colormap, colorbar) using any number of custom colours, and allows you to arrange these colours by adjusting their relative positions with
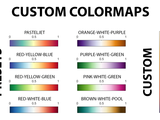
This function is able to define a customized colormap given the positions and the colors that are required to make the gradients.
', 'pink-white-green', 'brown-white-pool'.Example of use:J = customcolormap([0 0.5 1], {'#ffffff','#ff0000','#000000'});colorbar; colormap(J); axis off;

The complete palette of ColorBrewer colormaps. Simple selection by scheme name and map length.
ColorBrewer 2.0 colorschemes for MATLAB, with simple selection by colormap length and scheme name. Alternatively the scheme name can be preselected, after which only the colormap length is required to define an
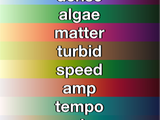
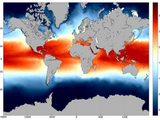
Perceptually-uniform colormaps inspired by oceanography
These colormaps were developed by Kristen Thyng using viscm. They are perceptually uniform, as color should be when it serves as a numeric axis. If these colormaps are useful for you, please consider
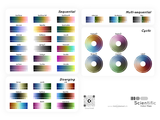
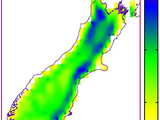
Perceptually uniform scientific colormaps from Fabio Crameri.
AboutA simple Matlab function for Fabio Crameri's perceptually uniform scientific colormaps.Usagecrameri without any inputs displays the options for colormaps.crameri ColormapName sets the colormap
MATLAB color utilities including COLORMAP join and interpolation; freeze and fit COLORBAR, etc.
These are some utilities that improve the COLORMAP and COLORBAR functions. They are as follows, and each one includes help and examples: COLORMAP utilites:cmapping - Colormap linear
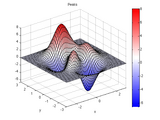
A colormap from bright blue, through white, and then to bright red.
REDBLUE(M), is an M-by-3 matrix that defines a colormap.The colors begin with bright blue, range through shades of blue to white, and then through shades of red to bright red. REDBLUE, by itself, is

MatPlotLib's default linear lightness colormap VIRIDIS and distinctive line colororder TAB10
From MatPlotLib 2 and 3:the default sequential colormap VIRIDIS (as well as INFERNO, MAGMA, and PLASMA),the default line colororder TAB10 (as well as TAB20, TAB20B, and TAB20C),the cyclic colormaps
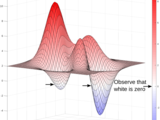
Colormap that linearly varies between red (+) white (=0) and blue(-)
This is a diverging colormap that linearly varies between red (+) white (=0) and blue(-).Just observe the figure
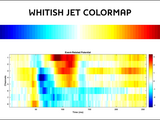
Jet-based colormap that contains white in its middle point.
This function defines a new colormap with the same colors that "jet", but it also replaces the green tones with white ones. This is specially useful when a signed metric is depicted, and its null
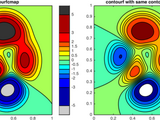
Creates a filled contour plot, with more precise control over colors than contourf.
# contourfcmap.m: filled contour plot with precise colormap[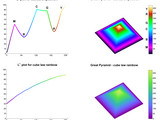
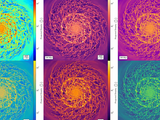
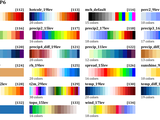
7 perceptual colormaps with rainbow-like colors and 1 with heat colors
PMKMP Returns perceptually balanced colormaps PMKMP(N,SCHEME) returns an Nx3 colormap. usage: map=pmkmp(n,scheme);%% Example1: 128-color rainbow with cubic-law luminance (default) load mandrill
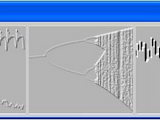
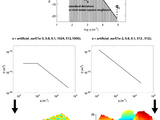
Chaotic generators demo can be used for studying the behavior of chaotic generators.
be called: 1. 2D attractor2. time and frequency domain 3. bifurcation diagram 4. histogram 5. bicoherenceFrom each tool a chaotic generator can be selected and its behavior studied. The chaotic
Buillds any sequence of colormaps based on wrgbcmyk colors
This function can be used to build your own custom colormaps. Imagine if you want to display rainfall distribution map. You want a colormap which ideally brings rainfall in mind, which is not
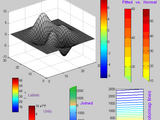
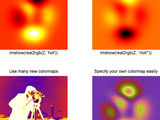
Use multiple colormaps per figure or axis! Works for many types of objects, not only images.
freezeColors/unfreezeColorsfreezeColors allows multiple colormaps to be used per figure and even within a single axis.HistoryIn 2005 freezeColors was written to enable multiple colormaps in a single
An easy gif generator
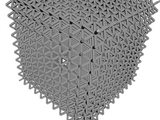
Lattice generator program in STL format for additive manufacturing
The Lattice Generator is a simple MatLab program that automatically generates various lattice geometries direct to STL format. These periodic structures are intended for use with the metallic
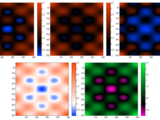
Superimpose multiple semitransparent images with individual colormaps on the current axis.
Remaps CData for multiple images, plotted in the current axis, to their respective individual colormaps. Multiple examples provided. The examples also demonstrate how semitransparent effects can be
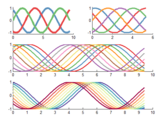
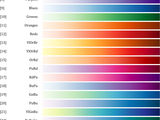
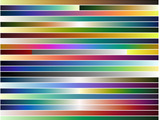
Plot lots of lines with very distinguishable and aesthetically pleasing colors. Works for 'N' colors
The default Matlab default line spec and colormaps are astoundingly crude. This function creates distinguishable colors by spacing them out ~equally in *perceptive* space, not in RGB space. It is
A colormap that attempts to be color blind friendly
Performs advaced colormap operations
ADVANCEDCOLORMAP Performs advaced colormap operationscmap = AdvancedColormap; Returns current colormap, much like COLORMAP does, but new figure is not createdcmaps =

Generate unstructured meshes for general two-dimensional geometries.
MESH2D is an unstructured mesh-generator for two-dimensional polygonal geometries, providing a range of relatively simple, yet effective two-dimensional meshing algorithms. MESH2D includes variations
Colormap with zero-center white shading.
When representing "polarized" data for which zero and sign are meaningful (like for instance, a gravity anomalies map), it is useful to have a colormap where white stands for zero value, and greater
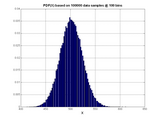
Efficient Random Variates Generator (from over 50 distributions).
RANDRAWEFFICIENT RANDOM VARIATES GENERATOR (from over 50 distributions):Alpha, Anglit, Antilognormal,Arcsin,Bernoulli, Bessel
Simple Matlab and python script that import colormaps from matplotlib into Matlab.
PyColormap4MatlabSimple Matlab and python script that import colormaps from matplotlib into Matlab.getPyPlot_cMap returns any colormap implemented in the matplotlib python library. It calls a python
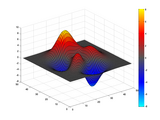
Generates randomly rough fractal surfaces with different fractal (Hurst) parameters
Easily design and fit a colormap to the values in your data!
Tristan Ursell Nov 2013 Adaptive colormap rgbslide(mat_in,...) slide_map = rgbslide(...); This function creates, on the fly, an active / adaptive colormap for the data given by the matrix
A collection of colormaps from https://matplotlib.org/cmocean/
A collection of perceptually uniform colormaps copied from https://matplotlib.org/cmocean/To set the colormap, use "colormap(Colormap.[mapname])"The [mapname] matches the names given in the original
Symmetric/diverging/bipolar cold-neutral-hot colormap
colormap with a linear intensity/luminance variation when results are converted to grayscale. This requires the neutral gray-level to be 0.5.
ncl colormaps
ncl colormaps
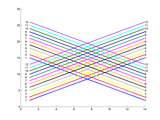
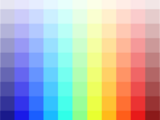
Choose a set of n colors that can be readily distinguished from each other
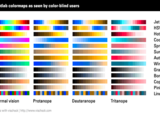
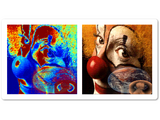
This image provides simulations of how the standard Matlab colormaps look to color-blind users.
The choice of colormaps for data visualization can affect the information accessible to color-blind users. For example large patches of cyan in an image with a bitonal cyan-magenta colormap (Matlab

Colormap in blue, white and red.
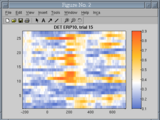
Returns a colormap for visualizing gene expression.
a simple function that returns a colormap, C, for visualizing gene expression. C is just a N x 3 matrix [R G B] describing the range of color values.example usage: C =
COLORMAPS3C lets you create your own colormaps.
COLORMAPS3C is able to create a custom colormap by specifying the 3 colors that you want to use in your colormap. The first will be at the bottom of the scale, the second will be the intermediate and
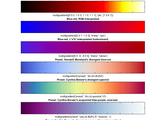
Generates the diverging redblue colormap from Tecplot. I needed a few times to display independent color bars on papers using tecplot charts
Generates the diverging redblue colormap from Tecplot. I needed a few times to display independent color bars on papers using tecplot charts.Inspired by
Create tints of colors and colormaps
Create specified tints of colors and colormaps or show examples of tints.To create shades, see http://www.mathworks.com/matlabcentral/fileexchange/47245-color-shades
Converts intensity matrices into truecolor images.
input colormap. The output can be displayed using IMAGE or IMSHOW, exported using IMWRITE, used for texture mapping, etc.Colormaps are specified either by name, or as a JxK colormap table (K = 3 or 4
truncated normal generator
Very fast generator of vectors from the standard multivariate normal or Gaussian distribution, truncated over the region [l,u]. The generator is designed for both speed and accuracy --- especially in

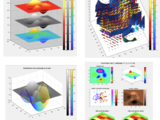
A simple tool for creating attractive and perceptually smooth colormaps
This tool simplifies the creation of perceptually linear and/or smooth colormaps for data visualization. The tool works by using palette colors selected by the user and performing all interpolations

The proposed Pulse Generator offers full tunability of its parameters on runtime.
Following steps explain the working principle of the proposed Programmable Pulse Generator:1. Taking the modulus of the free running simulation "Clock" with the "Period", gives a triangular wave
Create custom colormaps from single or multiple RGB values.
CMAP creates a custom colormap based on RGB values in the MATLAB format(values between 0-1). By specifying a base color, for example green: [0 1 0], CMAP creates a colormap with a specified number of
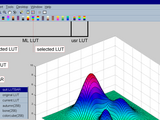
LUTBAR creates a colormap toolbar and context menu
if you are tired of trying colormap(xxx) at the command prompt to find the appropriate colormap for your figure - try LUTBARLUTBAR creates a colormap toolbar with colormap icons and context menu from
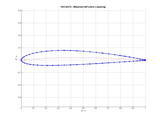
Generates the NACA 4 digit airfoil coordinates
option input wantPlot=1[2] A data file can be generated by setting the option input wantFile=1EXTENSION:Being a function, the airfoil generator can be called several times from a loop to generate any
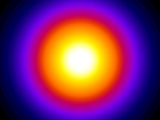
Use the 'fire' colormap in Matlab, or create your own.
FIRE Blue-Purple Hot colormapFIRE(M) returns an M-by-3 matrix containing a "fire" colormap.FIRE, by itself, is the same length as the current figure's colormap. If no figure exists, MATLAB creates
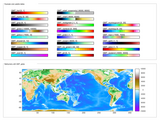
Create and apply GMT-style colormaps in Matlab
Exchange](https://www.mathworks.com/matlabcentral/images/matlab-file-exchange.svg)](https://www.mathworks.com/matlabcentral/fileexchange/28943-color-palette-tables-cpt-for-matlab)This function creates and applies a colormap defined in a color palette table (.cpt file). Color palette files provide more flexible colormapping than Matlab's default schemes, including both discrete

MATLAB live script to select, import, preview, and save the standard IPCC colormaps (Intergovernmental Panel on Climate Change)
?repo=mathworks/Standard-Climate-Colormaps-for-MATLAB)[
Generation Of Solid Shapes Using Random Number Generator.
Generation Of Solid Shapes Using Random Number Generator. The Solid Shapes included are:1) Cuboid/Cube2) Sphere3) Cone4) Conical Frustum5) Pyramid6) Pyramidal Frustum7) CylinderTake it as an exercise
A colormap with colors orange-white-light blue.
A colormap with colors orange-white-light blue. The length of the colormap can be defined with additional parameters (e.g. colormap(esa(256)).
You can also select a web site from the following list
Americas
- América Latina (Español)
- Canada (English)
- United States (English)
Europe
- Belgium (English)
- Denmark (English)
- Deutschland (Deutsch)
- España (Español)
- Finland (English)
- France (Français)
- Ireland (English)
- Italia (Italiano)
- Luxembourg (English)
- Netherlands (English)
- Norway (English)
- Österreich (Deutsch)
- Portugal (English)
- Sweden (English)
- Switzerland
- United Kingdom (English)
Asia Pacific
- Australia (English)
- India (English)
- New Zealand (English)
- 中国
- 日本Japanese (日本語)
- 한국Korean (한국어)