Curve Fitting Toolbox
Fit curves and surfaces to data using regression, interpolation, and smoothing
Have questions? Contact Sales.
Have questions? Contact Sales.
Curve Fitting Toolbox provides an app and functions for fitting curves and surfaces to data. The toolbox lets you perform exploratory data analysis, preprocess and post-process data, compare candidate models, and remove outliers. You can conduct regression analysis using the library of linear and nonlinear models provided or specify your own custom equations. The library provides optimized solver parameters and starting conditions to improve the quality of your fits. The toolbox also supports nonparametric modeling techniques, such as splines, interpolation, and smoothing.
After creating a fit, you can apply a variety of post-processing methods for plotting, interpolation, and extrapolation; estimating confidence intervals; and calculating integrals and derivatives.

Interactively fit data to curves and surfaces, visualize plots, and understand fitting statistics using the Curve Fitter app. Explore various fitting methods and options through the app and generate MATLAB code for reusability and automation.

Model a continuous response variable as a function of predictors using linear and nonlinear regression techniques, including custom equations with adequate options to optimize solver parameters and starting conditions to improve fit quality.

Estimate values between known data points using Interpolation techniques. Extrapolate values outside the fitting data domain for interpolant curves and surfaces.

Reduce noise and remove seasonal trends in the data set by applying smoothing techniques and other methods such as moving average, Savitzky-Golay filter, and Lowess models or by fitting a smoothing spline.

Fit various splines to data, including cubic and smoothing splines with various end conditions, for curves, surfaces, and higher dimensional objects. Control advanced spline operations, including break/knot manipulation, optimal knot placement, and data-point weighting.

Analyze the fitted model by exploring and customizing plots, estimating confidence intervals, and calculating integrals and derivatives. Export fitted models as Simulink lookup table blocks or fitted objects.
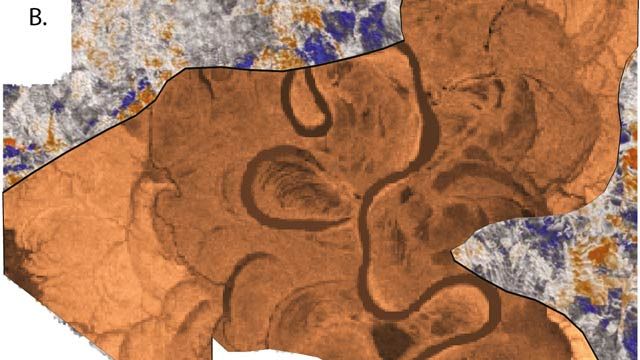
Shell developed an application for quantitatively characterizing subsurface geologic features to reduce oil and gas exploration costs.
“MATLAB enabled us, as geologists, to use our expertise in predictive frameworks, analytics, and analog matching to implement algorithms that are unique in our industry. With the help of MathWorks consultants, we then deployed those algorithms as an easy-to-use application to our colleagues worldwide.”
Curve Fitting Toolbox is a MATLAB product that provides an app and functions for fitting curves and surfaces to data using regression, interpolation, and smoothing techniques.
The Curve Fitter app is an interactive tool that lets you fit data to curves and surfaces, visualize plots, understand fitting statistics, and generate MATLAB code for reusability and automation.
Yes. Curve Fitting Toolbox supports surface fitting to data with two independent variables using polynomial surface models, interpolation methods (linear, nearest neighbor, cubic, biharmonic, thin-plate spline), and Lowess smoothing. You can fit surfaces interactively in the Curve Fitter app or programmatically using the fit function.
Yes, you can specify your own custom equations for both linear and nonlinear regression models, in addition to using the library of prebuilt models provided by the toolbox
The toolbox includes a library of common model types for curves and surfaces: polynomial, exponential, Fourier series, Gaussian, power, rational, sum of sines, and Weibull models. For surfaces, it provides polynomial surface fits and interpolation methods including linear, nearest neighbor, cubic, biharmonic, and thin-plate spline. You can also define your own custom equations.
The toolbox provides goodness-of-fit statistics including R-squared, adjusted R-squared, RMSE, and SSE. You can also explore residual plots, estimate confidence and prediction intervals, and compare candidate models to assess fit quality.
Yes. The toolbox provides smoothing techniques including moving average, Savitzky-Golay filter, Lowess and Loess models, and smoothing splines to reduce noise in data.
Base MATLAB includes basic fitting functions like polyfit for polynomials and interp1 for interpolation. Curve Fitting Toolbox adds a broader library of nonlinear models (exponential, Gaussian, Fourier, rational, and more), custom equation support with parameter bounds and start points, the interactive Curve Fitter app, surface fitting, goodness-of-fit statistics, confidence and prediction intervals, and the ability to generate code and export to Simulink.
Discover the possibilities today.
Get pricing information and explore related products.
Your school may already provide access to MATLAB, Simulink, and add-on products through a campus-wide license.

Tutorial


