contour3
3-D contour plot
Syntax
Description
contour3( creates a 3-D contour plot
containing the isolines of matrix Z)Z, where Z
contains height values on the x-y plane. MATLAB® automatically selects the contour lines to display. The column and row indices
of Z are the x and y coordinates
in the plane, respectively.
contour3(___, specifies the
contour lines to display as the last argument in any of the previous syntaxes. Specify
levels)levels as a scalar value n to display the contour
lines at n automatically chosen levels (heights). To draw the contour
lines at specific heights, specify levels as a vector of monotonically
increasing values. To draw the contours at one height (k), specify
levels as a two-element row vector [k k].
contour3(___, specifies
the style and color of the contour lines.LineSpec)
contour3(___, specifies
additional options for the contour plot using one or more name-value pair arguments. Specify
the options after all other input arguments. For a list of properties, see Contour Properties.Name,Value)
contour3( displays the
contour plot in the target axes. Specify the axes as the first argument in any of the
previous syntaxes.ax,___)
M = contour3(___)M, which contains the (x,
y) coordinates of the vertices at each level.
Examples
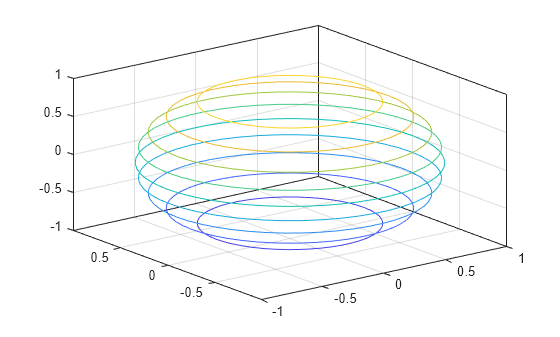
Define Z as a function of X and Y. In this case, call the sphere function to create X, Y, and Z. Then plot the contours of Z.
[X,Y,Z] = sphere(50);
contour3(X,Y,Z);
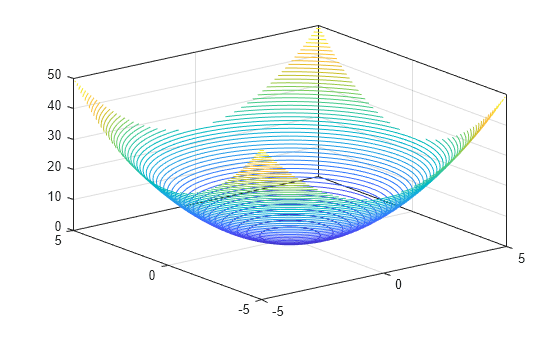
Define Z as a function of two variables, X and Y. Then plot the contours of Z. In this case, let MATLAB® choose the contours and the limits for the x- and y-axes.
[X,Y] = meshgrid(-5:0.25:5);
Z = X.^2 + Y.^2;
contour3(Z)
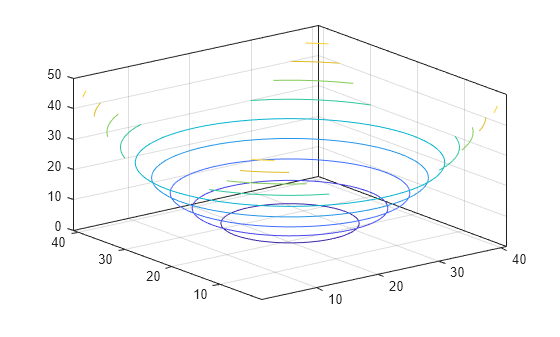
Now specify 50 contour levels, and display the results within the x and y limits used to calculate Z.
contour3(X,Y,Z,50)
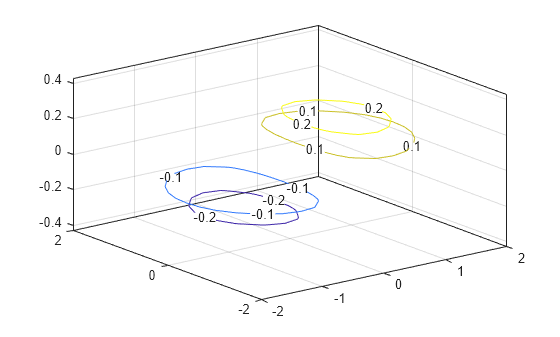
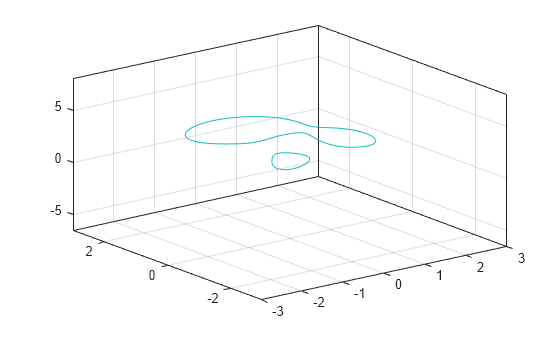
Define Z as a function of two variables, X and Y. Then plot the contours at Z = [-.2 -.1 .1 .2]. Show the contour labels by setting the ShowText property to 'on'.
[X,Y] = meshgrid(-2:0.25:2);
Z = X.*exp(-X.^2-Y.^2);
contour3(X,Y,Z,[-.2 -.1 .1 .2],'ShowText','on')
Define Z as a function of X and Y. In this case, call the peaks function to create X, Y, and Z. Then display the contours at Z = 2.
[X,Y,Z] = peaks;
contour3(X,Y,Z,[2 2]);
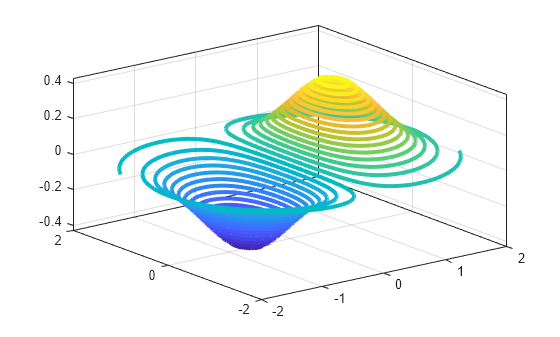
Define Z as a function of two variables, X and Y. Plot 30 contours of Z, and then set the line width to 3.
[X,Y] = meshgrid(-2:0.0125:2);
Z = X.*exp(-X.^2-Y.^2);
[M,c] = contour3(X,Y,Z,30);
c.LineWidth = 3;
Input Arguments
x-coordinates, specified as a matrix the same size as
Z, or as a vector with length n, where
[m,n] = size(Z). The default value of X is the
vector (1:n).
When X is a matrix, the values must be strictly increasing or
decreasing along one dimension and remain constant along the other dimension. The
dimension that varies must be the opposite of the dimension that varies in
Y. You can use the meshgrid function to create X and
Y matrices.
When X is a vector, the values must be strictly increasing or
decreasing.
Example: X = 1:10
Example: X = [1 2 3; 1 2 3; 1 2 3]
Example: [X,Y] = meshgrid(1:10)
The XData property of the Contour object
stores the x-coordinates.
Data Types: single | double | int8 | int16 | int32 | int64 | uint8 | uint16 | uint32 | uint64
y-coordinates, specified as a matrix the same size as
Z, or as a vector with length m, where
[m,n] = size(Z). The default value of Y is the
vector (1:m).
When Y is a matrix, the values must be strictly increasing or
decreasing along one dimension and remain constant along the other dimension. The
dimension that varies must be the opposite of the dimension that varies in
X. You can use the meshgrid function to create the X and
Y matrices.
When Y is a vector, the values must be strictly increasing or
decreasing.
Example: Y = 1:10
Example: Y = [1 1 1; 2 2 2; 3 3 3]
Example: [X,Y] = meshgrid(1:10)
The YData property of the Contour object
stores the y-coordinates.
Data Types: single | double | int8 | int16 | int32 | int64 | uint8 | uint16 | uint32 | uint64
z-coordinates, specified as a matrix. This matrix must have at least two rows and two columns, and it must contain at least two different values.
Example: Z = peaks(20)
The ZData property of the Contour object
stores the z-coordinates.
Data Types: single | double | int8 | int16 | int32 | int64 | uint8 | uint16 | uint32 | uint64
Contour levels, specified as a scalar whole number or a vector. Use this argument to
control the number and location of the contour lines. When you do not specify the
levels, the contour3 function chooses the levels automatically.
To draw contour lines at n automatically chosen heights, specify
levelsas the scalar value n.To draw the contour lines at specific heights, specify
levelsas a vector of monotonically increasing values.To draw contour lines at a single height
k, specifylevelsas a two-element row vector[k k].
Example: contour3(peaks,10) draws contour lines at 10
automatically chosen heights on the peaks function.
Example: contour3(peaks,[-4 0 4]) draws contour lines at 3
specific heights on the peaks function: -4,
0, and 4.
Example: contour3(peaks,[3 3]) draws contour lines to show where
the height of the peaks function is
3.
Data Types: single | double | int8 | int16 | int32 | int64 | uint8 | uint16 | uint32 | uint64
Line style and color, specified as a character vector or string scalar containing characters
and symbols. The characters and symbols can appear in any order. You can specify the
line style, line color, or both. Marker symbols such as 'o' are
ignored.
Example: '--g' is a green dashed line.
| Line Style | Description | Resulting Line |
|---|---|---|
"-" | Solid line |
|
"--" | Dashed line |
|
":" | Dotted line |
|
"-." | Dash-dotted line |
|
| Color Name | Short Name | Appearance |
|---|---|---|
'red' | 'r' |
|
'green' | 'g' |
|
'blue' | 'b' |
|
'cyan'
| 'c' |
|
'magenta' | 'm' |
|
'yellow' | 'y' |
|
'black' | 'k' |
|
'white' | 'w' |
|
Target axes, specified as an Axes object. If you do not specify
the axes, then contour3 plots into the current axes.
Name-Value Arguments
Output Arguments
Extended Capabilities
Version History
Introduced before R2006a