contourf
Filled 2-D contour plot
Syntax
Description
contourf( creates a filled contour plot
containing the isolines of matrix Z)Z, where Z
contains height values on the x-y plane. MATLAB® automatically selects the contour lines to display. The column and row indices
of Z are the x and y coordinates
in the plane, respectively.
contourf(___, specifies the
contour lines to display as the last argument in any of the previous syntaxes. Specify
levels)levels as a scalar value n to display the contour
lines at n automatically chosen levels (heights). To draw the contour
lines at specific heights, specify levels as a vector of monotonically
increasing values. To draw the contours at one height (k), specify
levels as a two-element row vector [k k].
contourf(___, specifies
additional options for the contour plot using one or more name-value pair arguments. Specify
the options after all other input arguments. For a list of properties, see Contour Properties.Name,Value)
contourf( displays the
contour plot in the target axes. Specify the axes as the first argument in any of the
previous syntaxes.ax,___)
M = contourf(___)M, which contains the (x,
y) coordinates of the vertices at each level.
Examples
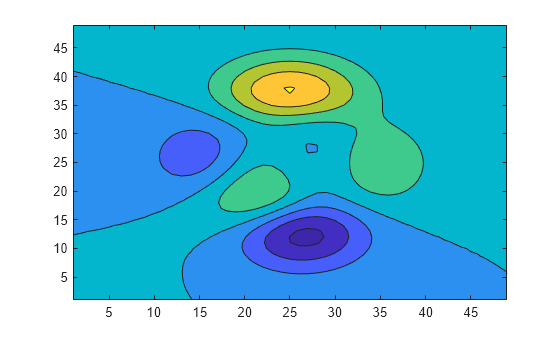
Define Z as a function of two variables. In this case, call the peaks function to create Z. Then display a filled contour plot of Z, letting MATLAB® choose the contour levels.
Z = peaks;
contourf(Z)
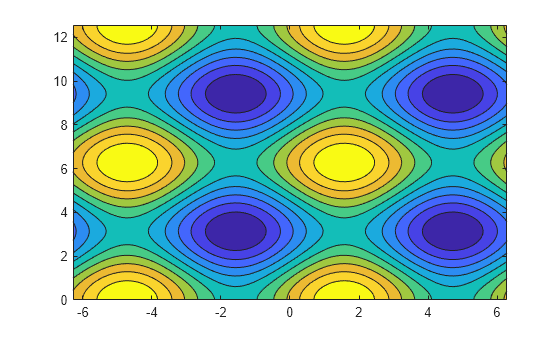
Define Z as a function of two variables, X and Y. Then display contours at 10 levels of Z.
x = linspace(-2*pi,2*pi);
y = linspace(0,4*pi);
[X,Y] = meshgrid(x,y);
Z = sin(X) + cos(Y);
contourf(X,Y,Z,10)
Define Z as a function of X and Y. In this case, call the peaks function to create X, Y, and Z. Then display contours at levels 2 and 3.
The white region corresponds to the heights less than 2. The purple region corresponds to heights between 2 and 3. And the yellow region corresponds to heights that are greater than 3.
[X,Y,Z] = peaks(50);
contourf(X,Y,Z,[2 3],'ShowText','on')

Since R2022b
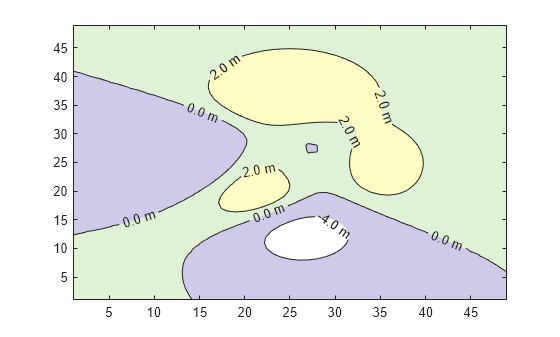
Create a contour plot that displays labels with one digit after the decimal point followed by the letter m. Specify a partially transparent fill color by setting the FaceAlpha property to 0.25.
contourf(peaks,[-4 0 2],"ShowText",true,"LabelFormat","%0.1f m", ...
    "FaceAlpha",0.25)
Since R2022b
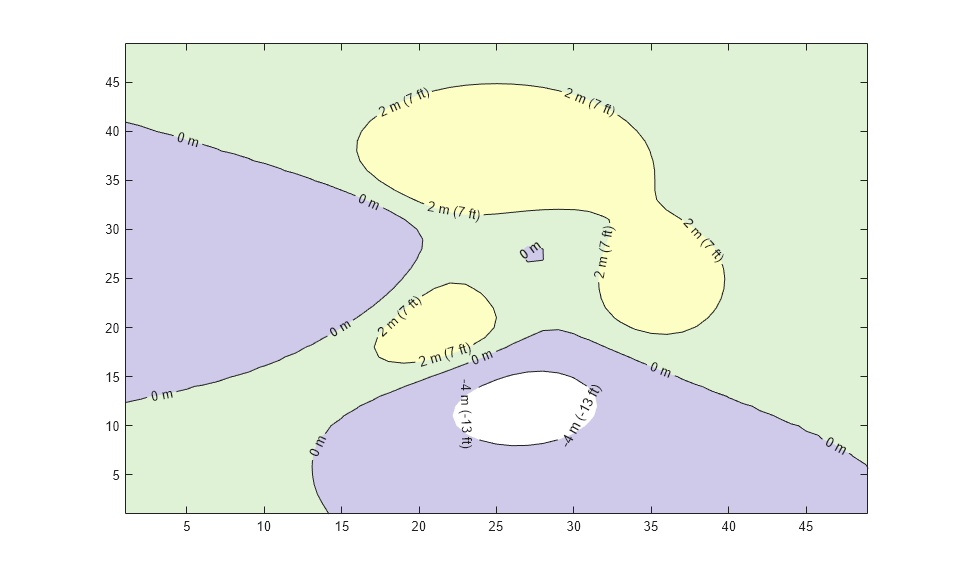
You can specify a function to format the labels when you need to calculate values. For example, you can define a function to calculate the label values in different units.
Define this function in a program file called mylabelfun.m. The function converts the input from meters to feet and returns a string vector containing each value in meters with the equivalent value in feet in parentheses.
function labels = mylabelfun(vals)
feetPerMeter = 3.28084;
feet = round(vals.*feetPerMeter);
labels = vals + " m (" + feet + " ft)";
labels(vals == 0) = "0 m";
end
Next, create a contour plot and specify the LabelFormat property as a handle to mylabelfun. Specify a partially transparent fill color by setting the FaceAlpha value to 0.25.
contourf(peaks,[-4 0 2],"ShowText",true,"LabelFormat",@mylabelfun, ...
    "FaceAlpha",0.25)
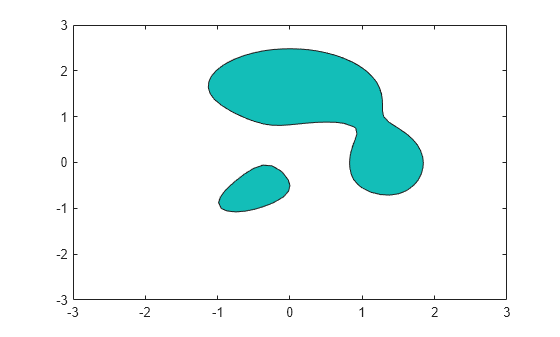
Define Z as a function of X and Y. In this case, call the peaks function to create X, Y, and Z. Then display contours at Z = 2.
[X,Y,Z] = peaks;
contourf(X,Y,Z,[2 2])
Create a contour plot, and specify the dashed line style.
[X,Y,Z] = peaks;
contourf(X,Y,Z,'--')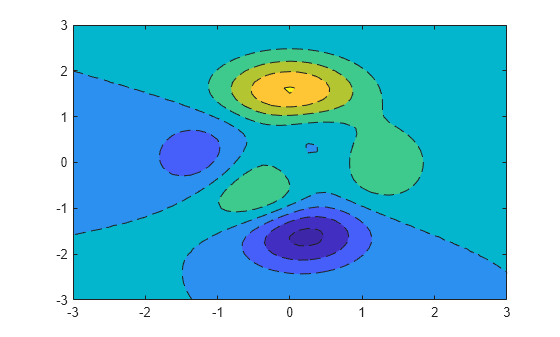
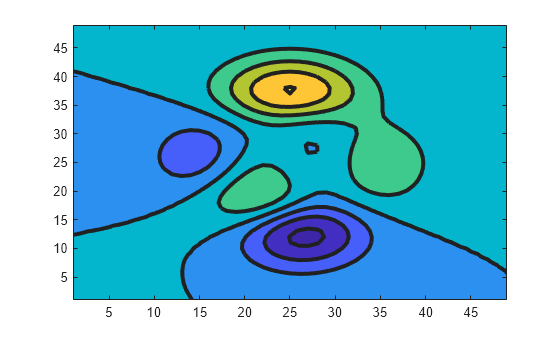
Create a filled contour plot. Make the contour lines thicker by setting the LineWidth property to 3.
Z = peaks;
[M,c] = contourf(Z);
c.LineWidth = 3;
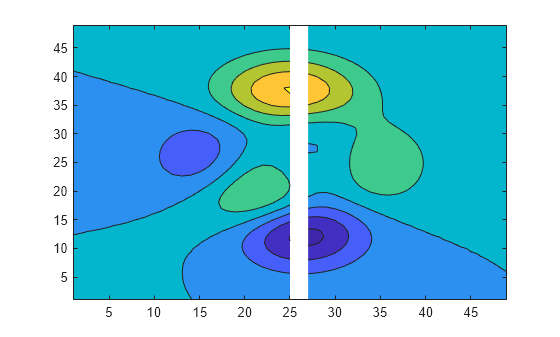
Insert NaN values wherever there are discontinuities on a surface. The contourf function does not draw contour lines in those regions.
Define matrix Z as a sampling of the peaks function. Replace all values in column 26 with NaN values. Then plot the contours of the modified Z matrix.
Z = peaks;
Z(:,26) = NaN;
contourf(Z)
Input Arguments
x-coordinates, specified as a matrix the same size as
Z, or as a vector with length n, where
[m,n] = size(Z). The default value of X is the
vector (1:n).
When X is a matrix, the values must be strictly increasing or
decreasing along one dimension and remain constant along the other dimension. The
dimension that varies must be the opposite of the dimension that varies in
Y. You can use the meshgrid function to create X and
Y matrices.
When X is a vector, the values must be strictly increasing or
decreasing.
Example: X = 1:10
Example: X = [1 2 3; 1 2 3; 1 2 3]
Example: [X,Y] = meshgrid(1:10)
The XData property of the Contour object
stores the x-coordinates.
Data Types: single | double | int8 | int16 | int32 | int64 | uint8 | uint16 | uint32 | uint64
y-coordinates, specified as a matrix the same size as
Z, or as a vector with length m, where
[m,n] = size(Z). The default value of Y is the
vector (1:m).
When Y is a matrix, the values must be strictly increasing or
decreasing along one dimension and remain constant along the other dimension. The
dimension that varies must be the opposite of the dimension that varies in
X. You can use the meshgrid function to create the X and
Y matrices.
When Y is a vector, the values must be strictly increasing or
decreasing.
Example: Y = 1:10
Example: Y = [1 1 1; 2 2 2; 3 3 3]
Example: [X,Y] = meshgrid(1:10)
The YData property of the Contour object
stores the y-coordinates.
Data Types: single | double | int8 | int16 | int32 | int64 | uint8 | uint16 | uint32 | uint64
z-coordinates, specified as a matrix. This matrix must have at least two rows and two columns, and it must contain at least two different values.
Example: Z = peaks(20)
The ZData property of the Contour object
stores the z-coordinates.
Data Types: single | double | int8 | int16 | int32 | int64 | uint8 | uint16 | uint32 | uint64
Contour levels, specified as a scalar whole number or a vector. Use this argument to
control the number and location of the contour lines. When you do not specify the
levels, the contourf function chooses the levels automatically.
To draw contour lines at n automatically chosen heights, specify
levelsas the scalar value n.To draw the contour lines at specific heights, specify
levelsas a vector of monotonically increasing values.To draw contour lines at a single height
k, specifylevelsas a two-element row vector[k k].
The contourf function uses the current colormap to fill the
spaces between the levels in the plot. The first color fills the space between the
lowest level and the level above it. The last color corresponds to
Z-values that are greater than the highest level in the plot. If
Z contains values that are smaller than the lowest level
displayed in the plot, the region between the lowest level and the smallest
Z-value is white.
Example: contourf(peaks,10) draws contour lines at 10
automatically chosen heights on the peaks function.
Example: contourf(peaks,[-4 0 4]) draws contour lines at 3
specific heights on the peaks function: -4,
0, and 4.
Example: contourf(peaks,[3 3]) draws contour lines to show where
the height of the peaks function is
3.
Data Types: single | double | int8 | int16 | int32 | int64 | uint8 | uint16 | uint32 | uint64
Line style and color, specified as a character vector or string scalar containing characters
and symbols. The characters and symbols can appear in any order. You can specify the
line style, line color, or both. Marker symbols such as 'o' are
ignored.
Example: '--g' is a green dashed line.
| Line Style | Description | Resulting Line |
|---|---|---|
"-" | Solid line |
|
"--" | Dashed line |
|
":" | Dotted line |
|
"-." | Dash-dotted line |
|
| Color Name | Short Name | Appearance |
|---|---|---|
'red' | 'r' |
|
'green' | 'g' |
|
'blue' | 'b' |
|
'cyan'
| 'c' |
|
'magenta' | 'm' |
|
'yellow' | 'y' |
|
'black' | 'k' |
|
'white' | 'w' |
|
Target axes, specified as an Axes object. If you do not specify
the axes, then contourf plots into the current axes.
Name-Value Arguments
Output Arguments
Extended Capabilities
Version History
Introduced before R2006a