ezcontour
(Not recommended) Easy-to-use contour plotter
ezcontour is not recommended. Use fcontour instead. For more information, see Version History.
Description
ezcontour(
plots over the specified interval. To use the same interval for both
f,xyinterval)x and y, specify
xyinterval as a two-element vector of the form
[min max]. To use different intervals, specify a four-element
vector of the form [xmin xmax ymin ymax].
ezcontour(___, plots using
an n)n-by-n grid. Use this option after any of
the input argument combinations in the previous syntaxes.
ezcontour( plots into
the axes specified by ax,___)ax instead of the current axes. Specify
the axes before any of the input argument combinations in any of the previous
syntaxes.
c = ezcontour(___) returns the contour object.
Use c to modify the contour after it is created. For a list of
properties, see Contour Properties.
Examples
This mathematical expression defines a function of two variables, x and y.
The ezcontour function requires a function handle argument. Write this mathematical expression in MATLAB® syntax as an anonymous function with handle f. You can define an anonymous function in the command window without creating a separate file. For convenience, write the function on three lines.
f = @(x,y) 3*(1-x).^2.*exp(-(x.^2) - (y+1).^2) ...
   - 10*(x/5 - x.^3 - y.^5).*exp(-x.^2-y.^2) ...
   - 1/3*exp(-(x+1).^2 - y.^2);
Pass the function handle, f, to ezcontour. Specify a domain from -3 to 3 in both the x-direction and y-direction and use a 49-by-49 computational grid.
ezcontour(f,[-3,3],49)
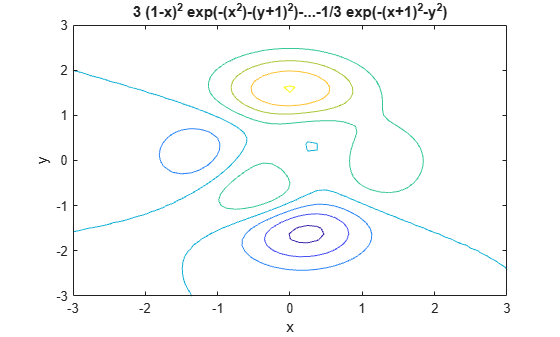
In this particular case, the title is too long to fit at the top of the graph, so MATLAB abbreviates it.