isocaps
Compute isosurface end-cap geometry
Syntax
fvc = isocaps(X,Y,Z,V,isovalue)

fvc = isocaps(V,isovalue)

fvc = isocaps(...,'enclose')

fvc = isocaps(...,'whichplane')

[f,v,c] = isocaps(...)

isocaps(...)
Description
fvc = isocaps(X,Y,Z,V,isovalue) computes
isosurface end-cap geometry for the volume data V at
isosurface value isovalue. The arrays X, Y,
and Z define the coordinates for the volume V.
The struct fvc contains the face, vertex,
and color data for the end-caps and can be passed directly to the patch command.
fvc = isocaps(V,isovalue) assumes
the arrays X, Y, and Z are
defined as [X,Y,Z] = meshgrid(1:n,1:m,1:p) where [m,n,p]
= size(V).
fvc = isocaps(...,'
specifies whether the end-caps enclose data values above or below
the value specified in enclose') isovalue. The 'enclose' option
can be either 'above' (default) or 'below'.
fvc = isocaps(...,' specifies
on which planes to draw the end-caps. Possible values for whichplane')'whichplane' are 'all' (default), 'xmin', 'xmax', 'ymin', 'ymax', 'zmin',
or 'zmax'.
[f,v,c] = isocaps(...) returns
the face, vertex, and color data for the end-caps in three arrays
instead of the struct fvc.
isocaps(...) without output
arguments draws a patch with the computed faces, vertices, and colors.
Examples
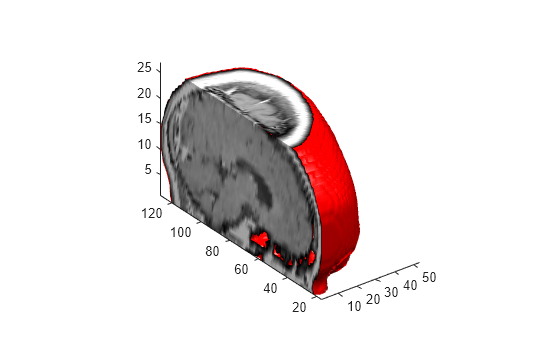
This example uses a data set that is a collection of MRI slices of a human skull. It illustrates the use of isocaps to draw the end-caps on this cutaway volume.
The red isosurface shows the outline of the volume (skull) and the end-caps show what is inside of the volume.
The patch created from the end-cap data (p2) uses interpolated face coloring, which means the gray colormap and the light sources determine how it is colored. The isosurface patch (p1) used a flat red face color, which is affected by the lights, but does not use the colormap.
load mri
D = squeeze(D);
D(:,1:60,:) = [];
p1 = patch(isosurface(D, 5),'FaceColor','red',...
	'EdgeColor','none');
p2 = patch(isocaps(D, 5),'FaceColor','interp',...
	'EdgeColor','none');
view(3)
axis tight
daspect([1,1,.4])
colormap(gray(100))
camlight left
camlight
lighting gouraud
isonormals(D,p1)
Extended Capabilities
Version History
Introduced before R2006a
See Also
isosurface | isonormals | smooth3 | subvolume | reducevolume | reducepatch