plotyy
(Not recommended) Create graph with two y-axes
plotyy is not recommended. Use yyaxis instead. For more information on updating your code, see Version
History.
Syntax
Description
plotyy( displays the left
plot in the specified axes instead of the current axes. If ax,___)ax is a
vector, then plotyy uses the first axes object in the vector. Specify
the axes as the first argument in any of the previous syntaxes.
Examples
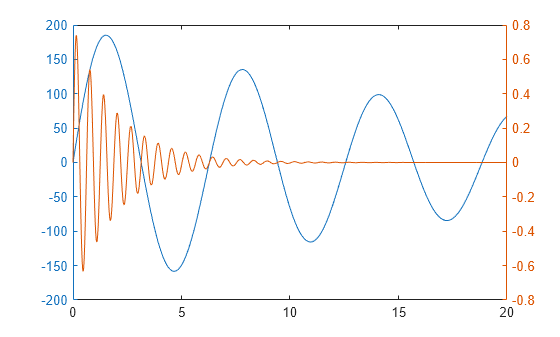
Plot two data sets on one graph using two y-axes.
x = 0:0.01:20;
y1 = 200*exp(-0.05*x).*sin(x);
y2 = 0.8*exp(-0.5*x).*sin(10*x);

figure
plotyy(x,y1,x,y2)
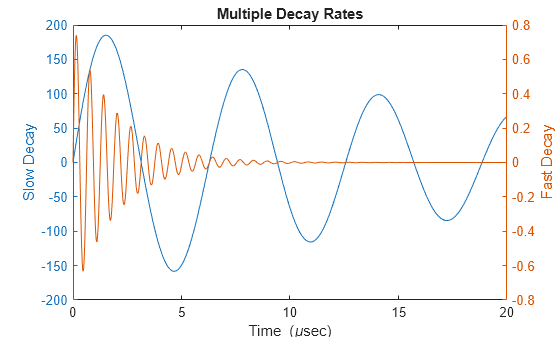
Plot two data sets using a graph with two y-axes. Add a title and axis labels.
x = 0:0.01:20;
y1 = 200*exp(-0.05*x).*sin(x);
y2 = 0.8*exp(-0.5*x).*sin(10*x);

figure
[hAx,hLine1,hLine2] = plotyy(x,y1,x,y2);

title("Multiple Decay Rates")
xlabel("Time (\musec)")

ylabel(hAx(1),"Slow Decay") % left y-axis
ylabel(hAx(2),"Fast Decay") % right y-axis
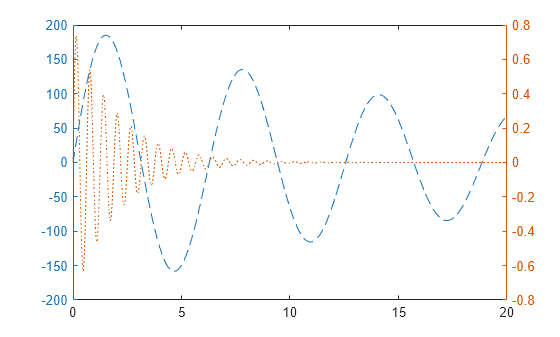
Plot two data sets using a graph with two y-axes. Change the line styles.
x = 0:0.01:20;
y1 = 200*exp(-0.05*x).*sin(x);
y2 = 0.8*exp(-0.5*x).*sin(10*x);

[hAx,hLine1,hLine2] = plotyy(x,y1,x,y2);
hLine1.LineStyle = "--";
hLine2.LineStyle = ":";
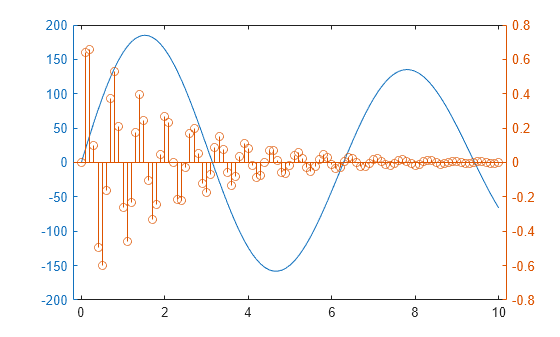
Plot two data sets using a graph with two y-axes. Use a line plot for the data associated with the left y-axes. Use a stem plot for the data associated with the right y-axes.
x = 0:0.1:10;
y1 = 200*exp(-0.05*x).*sin(x);
y2 = 0.8*exp(-0.5*x).*sin(10*x);

figure
plotyy(x,y1,x,y2,@plot,@stem)
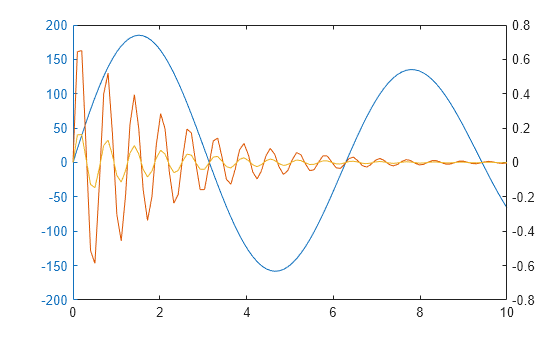
Plot three data sets using a graph with two y-axes. Plot one set of data associated with the left y-axis. Plot two sets of data associated with the right y-axis by using two-column matrices.
x = linspace(0,10);
y1 = 200*exp(-0.05*x).*sin(x);
y2 = 0.8*exp(-0.5*x).*sin(10*x);
y3 = 0.2*exp(-0.5*x).*sin(10*x);

figure
[hAx,hLine1,hLine2] = plotyy(x,y1,[x',x'],[y2',y3']);