trimesh
Triangular mesh plot
Syntax
Description
trimesh(___, specifies
options using one or more name-value arguments. For example,
Name,Value)trimesh(T,x,y,"LineWidth",2) sets the edge width to 2 points.
h = trimesh(___) returns a vector
of Line objects for a 2-D triangular mesh or a patch object used to create the mesh plot. Use h to query
and modify properties of the plot. For more information, see Line and
Patch Properties.
Examples
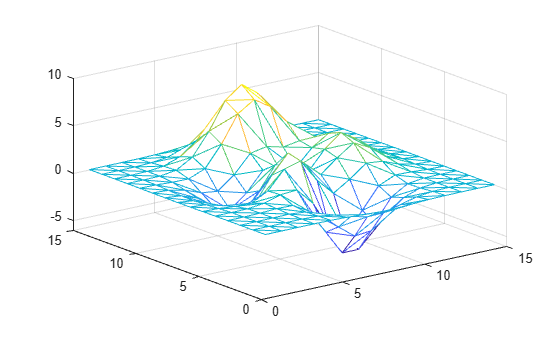
Create a set of 3-D points. Compute a Delaunay triangulation connectivity matrix using the delaunay function, and plot the mesh.
[x,y] = meshgrid(1:15,1:15);
z = peaks(15);
T = delaunay(x,y);
trimesh(T,x,y,z)

Alternatively, you can create a triangulation object to plot the mesh.
TO = triangulation(T,x(:),y(:),z(:));
trimesh(TO)
Input Arguments
Name-Value Arguments
Specify optional pairs of arguments as
Name1=Value1,...,NameN=ValueN, where Name is
the argument name and Value is the corresponding value.
Name-value arguments must appear after other arguments, but the order of the
pairs does not matter.
Example: trimesh(TO,"LineStyle"="--")
Before R2021a, use commas to separate each name and value, and enclose
Name in quotes.
Example: trimesh(TO,"LineStyle","--")
The properties listed here are only a subset. For a complete list, see Patch Properties.
Face color, specified as a color name, an RGB triplet, or
"none".
An RGB triplet is a three-element row vector whose elements specify the
intensities of the red, green, and blue components of the color. The intensities must
be in the range [0,1]; for example, [0.4 0.6
0.7]. This table lists the long and short color name options and the
equivalent RGB triplet values.
| Long Name | Short Name | RGB Triplet |
|---|---|---|
"yellow" | "y" | [1 1 0] |
"magenta" | "m" | [1 0 1] |
"cyan" | "c" | [0 1 1] |
"red" | "r" | [1 0 0] |
"green" | "g" | [0 1 0] |
"blue" | "b" | [0 0 1] |
"white" | "w" | [1 1 1] |
"black" | "k" | [0 0 0] |
Face transparency, specified as a scalar in the range [0,1]. A
value of 1 is opaque and 0 is completely transparent. Values between 0 and 1 are
semitransparent.
Edge color, specified as a color name, an RBG triplet, or
"none". The default color of [0 0 0]
corresponds to black boundaries.
An RGB triplet is a three-element row vector whose elements specify the
intensities of the red, green, and blue components of the color. The intensities must
be in the range [0,1]; for example, [0.4 0.6
0.7]. This table lists the long and short color name options and the
equivalent RGB triplet values.
| Long Name | Short Name | RGB Triplet |
|---|---|---|
"yellow" | "y" | [1 1 0] |
"magenta" | "m" | [1 0 1] |
"cyan" | "c" | [0 1 1] |
"red" | "r" | [1 0 0] |
"green" | "g" | [0 1 0] |
"blue" | "b" | [0 0 1] |
"white" | "w" | [1 1 1] |
"black" | "k" | [0 0 0] |
Line style, specified as one of the options listed in this table.
| Line Style | Description | Resulting Line |
|---|---|---|
"-" | Solid line |
|
"--" | Dashed line |
|
":" | Dotted line |
|
"-." | Dash-dotted line |
|
"none" | No line | No line |
Tips
To plot a mesh defined by a 2-D
triangulationordelaunayTriangulationobject, use thetriplotfunction.
Extended Capabilities
Version History
Introduced before R2006a
See Also
patch | delaunay | trisurf | delaunayTriangulation | triangulation | plot