Main Content

isotopicdist

Calculate high-resolution isotope mass distribution and density function

    Description

    [MD,Info,DF] = isotopicdist(SeqAA) analyzes a peptide sequence and returns a matrix containing the expected mass distribution; a structure containing the monoisotopic mass, average mass, most abundant mass, nominal mass, empirical formula, and a matrix containing the expected density function.

    example

    [MD,Info,DF] = isotopicdist(Compound) analyzes a compound specified by a numeric vector or matrix.

    example

    [MD,Info,DF] = isotopicdist(Formula) analyzes a compound specified by an empirical chemical formula represented by the structure Formula. The field names in Formula must be valid element symbols and are case sensitive. The respective values in Formula are the number of atoms for each element. Formula can also be an array of structures that specifies multiple formulas. The field names can be in any order within a structure. However, if there are multiple structures, the order must be the same in each.

    [MD,Info,DF] = isotopicdist(___,Name,Value) calculate high-resolution isotope mass distribution and density function using one or more Name,Value arguments. Use name-value arguments with any combination of arguments from the previous syntaxes.

    example

    Examples

    collapse all

    Calculate and display the isotopic mass distribution of the peptide sequence MATLAP with an Acetyl N-terminal and an Amide C-terminal:ю

    MD = isotopicdist("MATLAP", ...
                       NTerminal="acetyl", ...
                       CTerminal="amide", ...
                       ShowPlot=true)
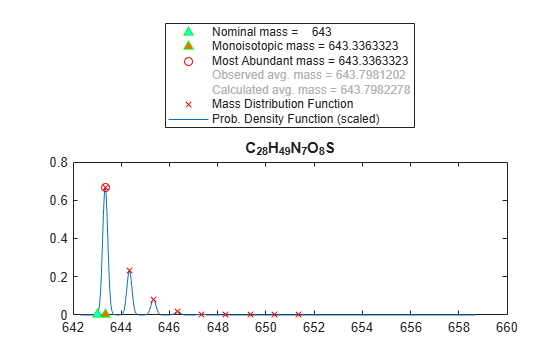
    Figure contains an axes object. The axes object with title C indexOf 28 baseline H indexOf 49 baseline N indexOf 7 baseline O indexOf 8 baseline S contains 5 objects of type line. One or more of the lines displays its values using only markers These objects represent Prob. Density Function (scaled), Mass Distribution Function, Nominal mass = 643, Monoisotopic mass = 643.3363323, Most Abundant mass = 643.3363323, Observed avg. mass = 643.7981202, Calculated avg. mass = 643.7982278.

    MD = 9×2
    
      643.3363    0.6676
      644.3388    0.2306
      645.3378    0.0797
      646.3386    0.0181
      647.3396    0.0033
      648.3409    0.0005
      649.3423    0.0001
      650.3439    0.0000
      651.3455    0.0000


    Calculate and display the isotopic mass distribution of Glutamine (С5H10N2O3):

    MD = isotopicdist([5 10 2 3 0],ShowPlot=true)

    Figure contains an axes object. The axes object with title C indexOf 5 baseline H indexOf 10 baseline N indexOf 2 baseline O indexOf 3 baseline contains 5 objects of type line. One or more of the lines displays its values using only markers These objects represent Prob. Density Function (scaled), Mass Distribution Function, Nominal mass = 146, Monoisotopic mass = 146.0691422, Most Abundant mass = 146.0691422, Observed avg. mass = 146.1447667, Calculated avg. mass = 146.144788.

    MD = 5×2
    
      146.0691    0.9328
      147.0715    0.0595
      148.0733    0.0074
      149.0755    0.0004
      150.0774    0.0000


    Display the isotopic mass distribution of the "averagine" model, whose molecular formula represents the statistical occurrences of amino acids from all known proteins.

    isotopicdist([4.9384 7.7583 1.3577 1.4773 0.0417])

    Figure contains an axes object. The axes object with title C indexOf 4 . 9384 baseline H indexOf 7 . 7583 baseline N indexOf 1 . 3577 baseline O indexOf 1 . 4773 baseline S indexOf 0 . 0417 baseline contains 5 objects of type line. One or more of the lines displays its values using only markers These objects represent Prob. Density Function (scaled), Mass Distribution Function, Nominal mass = 110.9981, Monoisotopic mass = 111.0543052, Most Abundant mass = 111.0543052, Observed avg. mass = 111.1237368, Calculated avg. mass = 111.1237566.

    Input Arguments

    collapse all

    Peptide sequence, specified as one of these values:

    • Character vector or string of single-letter codes

    • Cell array of character vectors or string vector that specifies multiple peptide sequences

    Tip

    You can use the getgenpept and genpeptread functions to retrieve peptide sequences from the GenPept database or a GenPept-formatted file. You can then use the cleave function to perform an insilico digestion on a peptide sequence. The cleave function creates a cell array of character vectors representing peptide fragments, which you can submit to the isotopicdist function.

    Data Types: char | string | cell

    Compound, specified as one of these values:

    • Numeric vector of form [C H N O S], where C, H, N, O, and S are nonnegative numbers that represent the number of atoms of carbon, hydrogen, nitrogen, oxygen, and sulfur respectively in a compound.

    • M-by-5 numeric matrix that specifies M compounds, with each row corresponding to a compound and each column corresponding to an atom.

    Data Types: double

    Chemical formula, specified as one of these values:

    • Structure whose field names are valid element symbols and case sensitive. Their respective values are the number of atoms for each element.

    • Array of structures that specifies multiple formulas.

    Note

    If Formula is a single structure, the order of the fields does not matter. If Formula is an array of structures, then the order of the fields must be the same in each structure.

    Data Types: struct

    Name-Value Arguments

    collapse all

    Specify optional pairs of arguments as Name1=Value1,...,NameN=ValueN, where Name is the argument name and Value is the corresponding value. Name-value arguments must appear after other arguments, but the order of the pairs does not matter.

    Example: NTerminal="acetyl",CTerminal="amide",ShowPlot=true

    Modification for the N-terminal of the peptide, specified as one of these values:

    • "none", "amine", "formyl", or "acetyl".

    • Custom modification, specified by an empirical formula, represented by a structure. The structure must have field names that are valid element symbols and case sensitive. Their respective values are the number of atoms for each element.

    Data Types: char | string | struct

    Modification for the C-terminal of the peptide, specified as one of these values:

    • "none", "freeacid", or "amide".

    • Custom modification specified by an empirical formula, represented by a structure. The structure must have field names that are valid element symbols and case sensitive. Their respective values are the number of atoms for each element.

    Data Types: char | string | struct

    Approximate resolution of the instrument (in daltons), specified as a number. Here, the resolution value is the Gaussian width at full width half height (FWHH).

    Data Types: double

    Number of data points per dalton for computing the FFT algorithm, specified as a number.

    Data Types: double

    Absolute range (window size) in daltons for the FFT algorithm and output density function, specified as a number. By default, this value is automatically estimated based on the weight of the molecule. The actual FFT range used internally by isotopicdist is further increased such that the FFTRange*FFTResolution value is a power of two.

    Increase the FFTRange value if the signal represented by the DF output value appears to be truncated.

    Ultrahigh resolution allows you to resolve micropeaks that have the same nominal mass, but slightly different exact masses. To achieve ultrahigh resolution, increase the FFTResolution value and reduce the Resolution value, but ensure that the FFTRange*FFTResolution value is within the available memory.

    Data Types: double

    Location of the FFT range (window) defined by FFTRange, specified as a fraction. This value sets the location of the lower limit of the FFT range, relative to the location of the monoisotopic peak, which is computed by isotopicdist. The location of the lower limit of the FFT range is set to the mass of the monoistopic peak -FFTLocation*FFTRange.

    Tip

    In rare cases where a compound contains an element, such as Iron or Argon, whose most abundant isotope is not the lightest one, shift the FFT range to the left.

    Data Types: double

    Noise threshold value, specified as a number. When you specify this value, isotopicdist removes points in the mass distribution that are smaller than 1/NoiseThreshold times the most abundant mass.

    Data Types: double

    Control for displaying the isotopic mass distribution plot, specified as false, true, or an integer specifying a compound. If set to true, the first compound is plotted. The default value is:

    • false — when you specify return values.

    • true — when you do not specify return values.

    Data Types: double

    Output Arguments

    collapse all

    Mass distribution, returned as a two-column matrix in which each row corresponds to an isotope. The first column lists the isotopic mass, and the second column lists the probability for that mass.

    Mass information for the peptide sequence or compound, returned as a structure with these fields:

    • NominalMass

    • MonoisotopicMass

    • ObservedAverageMass — Estimated from the DF signal output, using instrument resolution specified by the 'Resolution' property.

    • CalculatedAverageMass — Calculated directly from the input formula, assuming perfect instrument resolution.

    • MostAbundantMass

    • Formula — Structure containing the number of atoms of each element.

    Density function, returned as a two-column matrix. Each row corresponds to an m/z value. The first column lists the mass, and the second column lists the relative intensity of the signal at that mass.

    More About

    collapse all

    References

    [1] Rockwood, A. L., S. L. Van Orden, and R. D. Smith. "Rapid Calculation of Isotope Distributions." Anal. Chem. 67:15 (1995): 2699–2704.

    [2] Rockwood, A. L., S. L. Van Orden, and R. D. Smith. "Ultrahigh Resolution Isotope Distribution Calculations." Rapid Commun. Mass Spectrum 10 (1996): 54–59.

    [3] Senko, M.W., S. C. Beu, and F. W. McLafferty. "Automated assignment of charge states from resolved isotopic peaks for multiply charged ions." J. Am. Soc. Mass Spectrom. 6 (1995): 52–56.

    [4] Senko, M.W., S. C. Beu, and F. W. McLafferty. "Determination of monoisotopic masses and ion populations for large biomolecules from resolved isotopic distributions." J. Am. Soc. Mass Spectrom. 6 (1995): 229–233.

    Version History

    Introduced in R2009b