iqimbal
Apply I/Q imbalance to input signal
Description
Examples
Generate a 16-QAM signal. Display the scatter plot.
x = qammod(randi([0 15],1000,1),16);
h = scatterplot(x);
hold on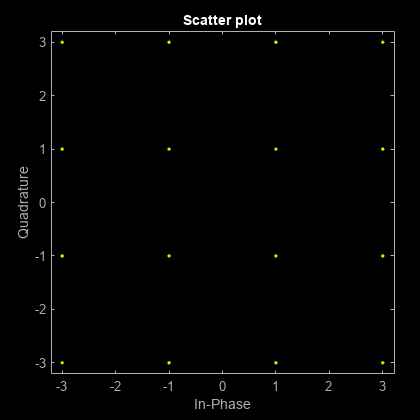
Apply a 10 dB amplitude imbalance. A positive amplitude imbalance causes horizontal stretching of the constellation.
y = iqimbal(x,10);
scatterplot(y,1,0,'o',h)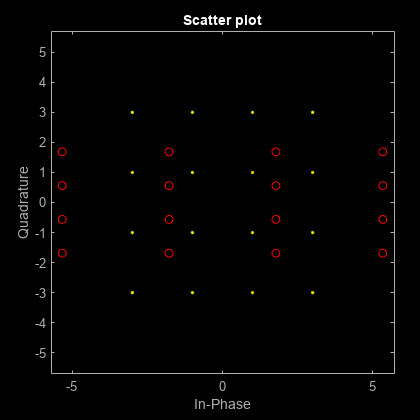
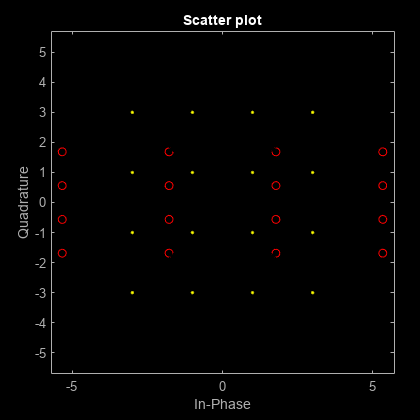
Apply a -10 dB amplitude imbalance. A negative amplitude imbalance causes vertical stretching of the constellation.
z = iqimbal(x,-10);
scatterplot(z,1,0,'*',h)
hold off
Generate a 16-QAM signal having two channels.
x = qammod(randi([0 15],1000,2),16);
Apply a 3 dB amplitude imbalance and a 10 degree phase imbalance to the first channel. Apply a –5 dB amplitude imbalance and a –15 degree phase imbalance to the second channel.
y = iqimbal(x,[3 -5],[10 -15]);
Plot the constellation diagram of both channels of the impaired signal.
h = scatterplot(y(:,1),1,0,'*');
hold on
scatterplot(y(:,2),1,0,'o',h)
hold off
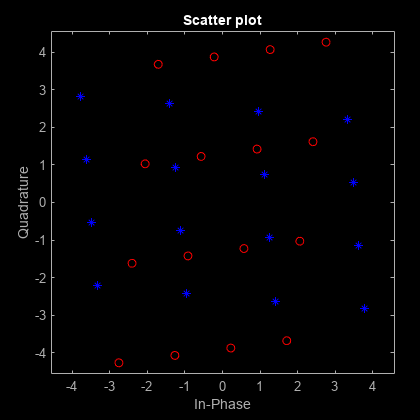
The first channel is stretched horizontally, and the second channel is stretched vertically.
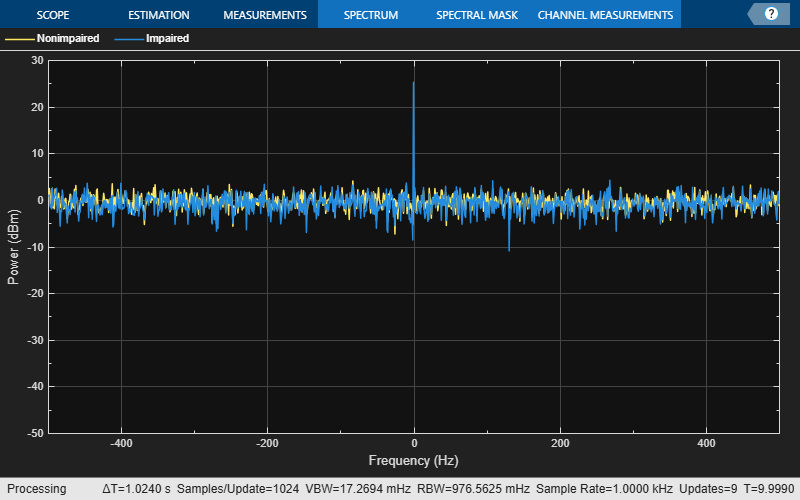
Apply a 1 dB, 5 degree I/Q imbalance to a QPSK signal. Then apply a DC offset. Visualize the offset using a spectrum analyzer.
Generate a QPSK sequence.
x = pskmod(randi([0 3],1e4,1),4,pi/4);
Apply a 1 dB amplitude imbalance and 5 degree phase imbalance to a QPSK signal. Apply a 0.5 + 0.3i DC offset.
y = iqimbal(x,1,5);
z = y + complex(0.5,0.3);
Plot the spectrum of the nonimpaired and impaired signals.
sa = spectrumAnalyzer( ...
    SampleRate=1000, ...
    ChannelNames=["Nonimpaired","Impaired"], ...
    YLimits=[-50 30]);
sa(x,z)
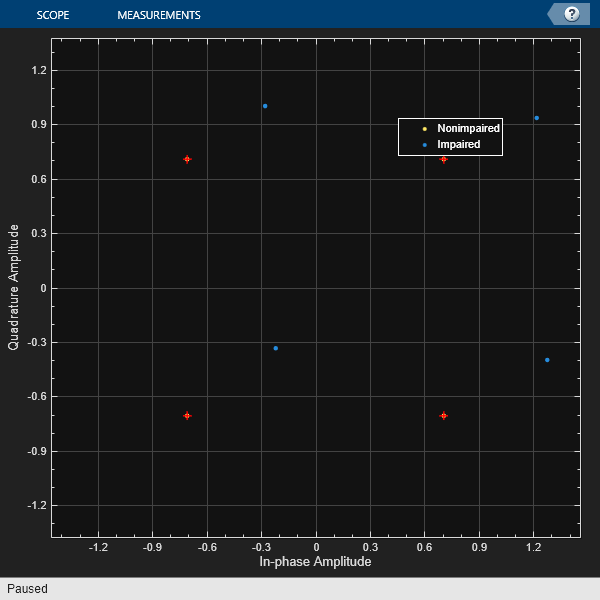
Display the corresponding scatter plot to see the effect of the I/Q imbalance and the DC offset.
cd = comm.ConstellationDiagram( ...
    NumInputPorts=2, ...
    ChannelNames=["Nonimpaired","Impaired"]);
cd(x,z)
Generate random data and apply 8-PSK modulation.
data = randi([0 7],2000,1);
txSig = pskmod(data,8,pi/8);
Pass the transmitted signal through an AWGN channel. Apply an I/Q imbalance.
noisySig = awgn(txSig,20);
rxSig = iqimbal(noisySig,2,20);
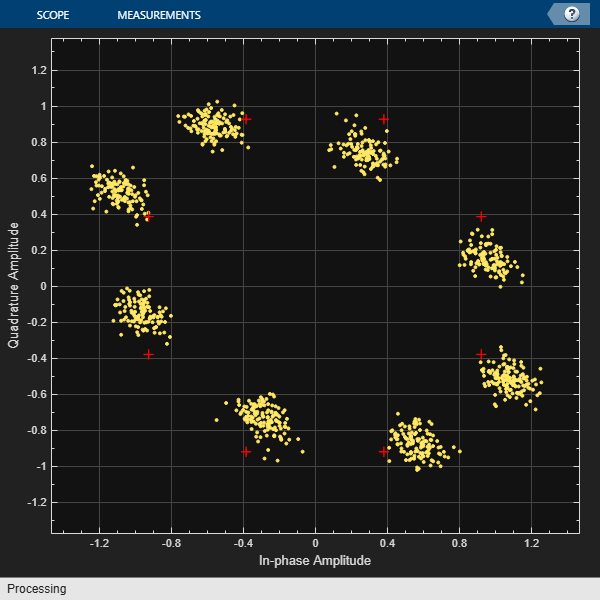
Create a constellation diagram object that displays only the last 1000 symbols. Plot the constellation diagram of the impaired signal.
cd = comm.ConstellationDiagram( ...
    ReferenceConstellation=pskmod(0:7,8,pi/8), ...
    SymbolsToDisplaySource='Property', ...
    SymbolsToDisplay=1000);
cd(rxSig)
Correct for the I/Q imbalance by using a comm.IQImbalanceCompensator object. Plot the constellation diagram of the signal after compensation.
iqComp = comm.IQImbalanceCompensator(StepSize=1e-3);
compSig = iqComp(rxSig);

cd(compSig)
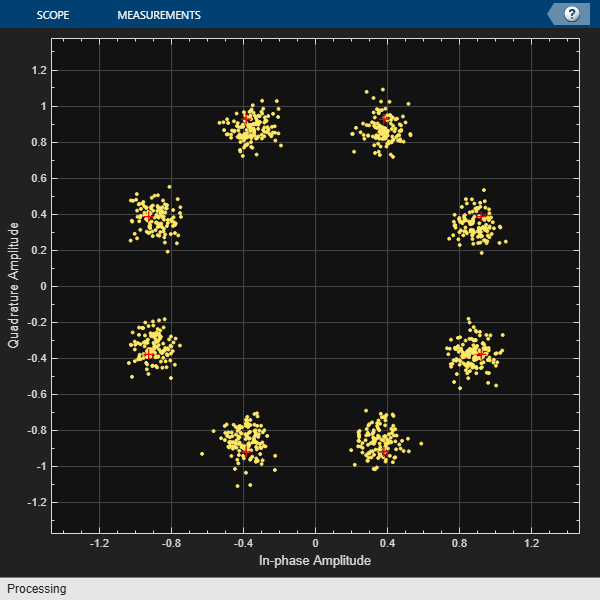
The compensator removes the I/Q imbalance.
Input Arguments
Output Arguments
Algorithms
The iqimbal function applies
an I/Q amplitude and phase imbalance to an input signal.
Given amplitude imbalance Ia in dB, the gain, g, resulting from the imbalance is defined as
Applying the I/Q imbalance to input signal x results in output signal y such that
where g is the imbalance gain and Ip is the phase imbalance in degrees.
Extended Capabilities
Version History
Introduced in R2016b
See Also
iqcoef2imbal | iqimbal2coef | comm.IQImbalanceCompensator | I/Q Imbalance