contour
Display contour map of RF propagation data in Site Viewer
Description
contour( creates a filled contour
plot from the specified propagation data object in the current Site Viewer.
Contours are colored according to data values of corresponding locations.pd)
contour(___,
specifies options using name-value arguments.Name=Value)
Examples
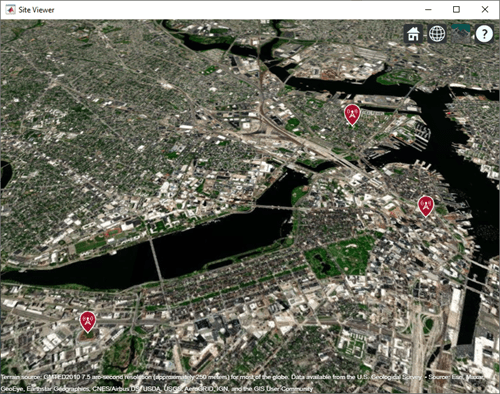
Define names and locations of sites around Boston.
names = ["Fenway Park","Faneuil Hall","Bunker Hill Monument"];
lats = [42.3467,42.3598,42.3763];
lons = [-71.0972,-71.0545,-71.0611];
Create an array of transmitter sites.
txs = txsite("Name",names,...
       "Latitude",lats,...
       "Longitude",lons, ...
       "TransmitterFrequency",2.5e9);
show(txs)
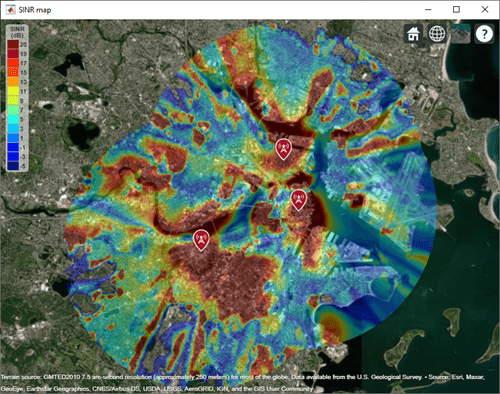
Create a signal-to-interference-plus-noise-ratio (SINR) map, where signal source for each location is selected as the transmitter site with the strongest signal.
sv1 = siteviewer("Name","SINR map");
sinr(txs,"MaxRange",5000)
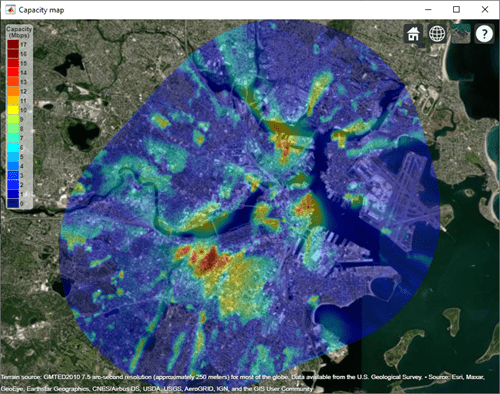
Return SINR propagation data.
pd = sinr(txs,"MaxRange",5000);
[sinrDb,lats,lons] = getDataVariable(pd,"SINR");
Compute capacity using the Shannon-Hartley theorem.
bw = 1e6; % Bandwidth is 1 MHz
sinrRatio = 10.^(sinrDb./10); % Convert from dB to power ratio
capacity = bw*log2(1+sinrRatio)/1e6; % Unit: Mbps
Create new propagation data for the capacity map and display the contour plot.
pdCapacity = propagationData(lats,lons,"Capacity",capacity);
sv2 = siteviewer("Name","Capacity map");
legendTitle = "Capacity" + newline + "(Mbps)";
contour(pdCapacity,"LegendTitle",legendTitle);
Input Arguments
Name-Value Arguments
Specify optional pairs of arguments as
Name1=Value1,...,NameN=ValueN, where Name is
the argument name and Value is the corresponding value.
Name-value arguments must appear after other arguments, but the order of the
pairs does not matter.
Example: contour(pd,Transparency=0.8) specifies the transparency
of the contour plot.
Before R2021a, use commas to separate each name and value, and enclose
Name in quotes.
Example: contour(pd,"Transparency",0.8) specifies the
transparency of the contour plot.
Data variable to contour, specified as a character vector or a string
scalar. The data variable must correspond to a variable name of the
table used to create the propagationData object.
Data Types: char | string
Type of value to plot, specified as "custom",
"power", "efield",
"sinr", or "pathloss". This
table shows the default color limits and legend title for each
type.
| Type | Color limits | Legend title |
|---|---|---|
"custom" | [min(Data) max(Data)] | '' |
"power" | [-120 -5] | Power (dBm) |
"efield" | [20 135] | E-field (dBuV/m) |
"sinr" | [-5 20] | SINR (dB) |
"pathloss" | [45 160] | Path loss (dB) |
Data Types: char | string
Data value levels to plot, specified as a numeric vector. Site Viewer
displays each level as a filled contour on the map. The function selects
the colors for the contours by using the Colors
argument, if specified, or else the Colormap and
ColorLimits arguments. The function does not
display data points with values below the minimum level.
The default value for Levels is a linearly spaced
vector bounded by the value of the ColorLimits
argument.
Data Types: double
Colors of the filled contours, specified as an
M-by-3 array of RGB triplets, an array of string
scalars, or a cell array of character vectors. The function assigns the
colors to the corresponding values specified by the
Levels argument.
The Colors argument cannot be combined with the
Colormap or ColorLimits
arguments.
Data Types: double | char | string
Colormap for coloring the points, specified as a colormap name or as an M-by-3 array of RGB triplets that define M individual colors.
This table lists the colormap names.
| Colormap Name | Color Scale |
|---|---|
|
|
|
|
|
|
|
|
|
|
|
|
|
|
|
|
|
|
|
|
|
|
|
|
|
|
|
|
|
|
|
|
|
|
|
|
|
|
|
|
|
|
|
|
The Colormap argument cannot be used with the
Colors argument.
Data Types: double | char | string
Color limits for the colormap, specified as a two-element vector of
the form [min max]. The color limits indicate the
data level values that map to the first and last colors in the colormap.
The ColorLimits argument cannot be used with the
Colors argument.
Data Types: double
Transparency of the contour plot, specified as a numeric scalar in the
range [0, 1]. 0 is completely transparent and
1 is completely opaque.
Data Types: double
Show the color legend on the map, specified as true
or false.
Data Types: logical
Title of the color legend, specified as a character vector or a string scalar.
Data Types: string | char
Map for the surface data, specified as a siteviewer
object.1
The default value is the current Site Viewer or a new Site Viewer, if none
is open.
Data Types: char | string
Version History
Introduced in R2020a
1 Alignment of boundaries and region labels are a presentation of the feature provided by the data vendors and do not imply endorsement by MathWorks®.