parabolicLaneBoundary
Parabolic lane boundary model
Description
The parabolicLaneBoundary object contains information about a parabolic
lane boundary model.
Creation
To generate parabolic lane boundary models that fit a set of boundary points and an
approximate width, use the findParabolicLaneBoundaries function. If
you already know your parabolic parameters, create lane boundary models by using the
parabolicLaneBoundary function (described here).
Description
boundaries = parabolicLaneBoundary(parabolicParameters)[A
B C] parameters for the parabolic equation y =
Ax2 + Bx +
C. Points within the lane boundary models are in world
coordinates.
Input Arguments
Properties
Object Functions
computeBoundaryModel | Obtain y-coordinates of lane boundaries given x-coordinates |
Examples
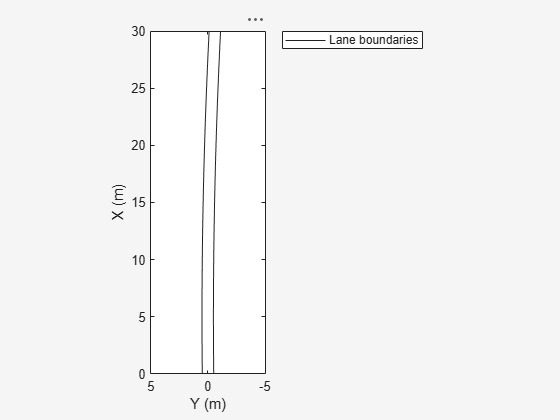
Create left-lane and right-lane parabolic boundary models.
llane = parabolicLaneBoundary([-0.001 0.01  0.5]);
rlane = parabolicLaneBoundary([-0.001 0.01 -0.5]);
Create a bird's-eye plot and lane boundary plotter. Plot the lane boundaries.
bep = birdsEyePlot('XLimits',[0 30],'YLimits',[-5 5]);
lbPlotter = laneBoundaryPlotter(bep,'DisplayName','Lane boundaries');
plotLaneBoundary(lbPlotter, [llane rlane]);
Find lanes in an image by using parabolic lane boundary models. Overlay the identified lanes on the original image and on a bird's-eye-view transformation of the image.
Load an image of a road with lanes. The image was obtained from a camera sensor mounted on the front of a vehicle.
I = imread('road.png');Transform the image into a bird's-eye-view image by using a preconfigured sensor object. This object models the sensor that captured the original image.
bevSensor = load('birdsEyeConfig');
birdsEyeImage = transformImage(bevSensor.birdsEyeConfig,I);
imshow(birdsEyeImage)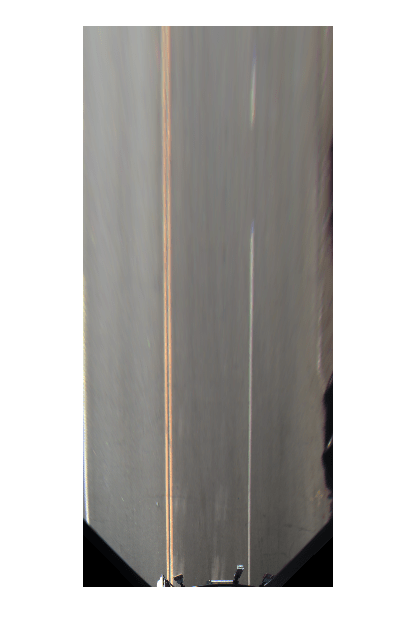
Set the approximate lane marker width in world units (meters).
approxBoundaryWidth = 0.25;
Detect lane features and display them as a black-and-white image.
birdsEyeBW = segmentLaneMarkerRidge(im2gray(birdsEyeImage), ...
    bevSensor.birdsEyeConfig,approxBoundaryWidth);
imshow(birdsEyeBW)
Obtain the image coordinates corresponding to the lane candidate positions. The find function returns pixel indices that correspond to the candidate lane positions. By convention, the order of the image coordinates is always reversed relative to the pixel indices. For more information about image coordinates, see Coordinate Systems.
Obtain the corresponding lane boundary points in vehicle coordinates by using the imageToVehicle function.
[imageY,imageX] = find(birdsEyeBW);
xyBoundaryPoints = imageToVehicle(bevSensor.birdsEyeConfig,[imageX,imageY]);
Find lane boundaries in the image by using the findParabolicLaneBoundaries function. By default, the function returns a maximum of two lane boundaries. The boundaries are stored in an array of parabolicLaneBoundary objects.
boundaries = findParabolicLaneBoundaries(xyBoundaryPoints,approxBoundaryWidth);
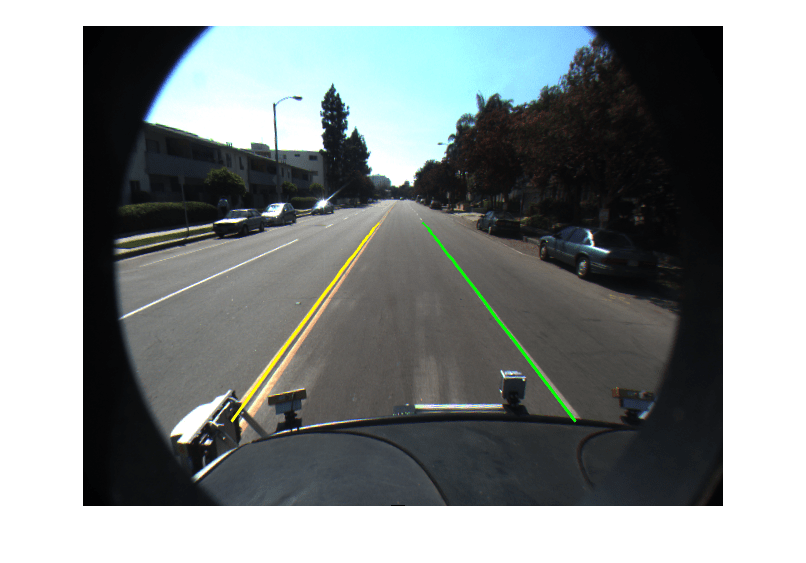
Use insertLaneBoundary to overlay the lanes on the original image. The XPoints vector represents the lane points, in meters, that are within range of the ego vehicle's sensor. Specify the lanes in different colors. By default, lanes are yellow.
XPoints = 3:30;

figure
sensor = bevSensor.birdsEyeConfig.Sensor;
lanesI = insertLaneBoundary(I,boundaries(1),sensor,XPoints);
lanesI = insertLaneBoundary(lanesI,boundaries(2),sensor,XPoints,'Color','green');
imshow(lanesI)
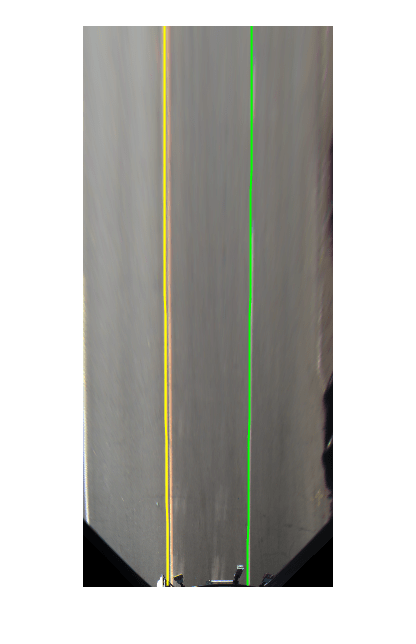
View the lanes in the bird's-eye-view image.
figure
BEconfig = bevSensor.birdsEyeConfig;
lanesBEI = insertLaneBoundary(birdsEyeImage,boundaries(1),BEconfig,XPoints);
lanesBEI = insertLaneBoundary(lanesBEI,boundaries(2),BEconfig,XPoints,'Color','green');
imshow(lanesBEI)
Extended Capabilities
Version History
Introduced in R2017a