cfplot
R2026bVisualize cash flows of financial instruments
Syntax
Description
cfplot(
plots a cash flow diagram for the specified cash flow amounts
(CFlowDates,CFlowAmounts)CFlowAmounts) and dates
(CFlowDates). The length and orientation of each arrow
correspond to the cash flow amount.
cfplot(
plots a cash flow diagram for the specified cash flow amounts using an optional
ax argument. ax,CFlowDates,CFlowAmounts)
cfplot(___,
plots a cash flow diagram for the specified cash flow amounts
(Name,Value)CFlowAmounts), dates
(CFlowDates), and optional name-value pair
arguments.
h = cfplot(___,Name,Value)
[ returns the
handles to the line objects and the axes using optional name-value pair
arguments. h,axes_handle]
= cfplot(___,Name,Value)
Examples
Define CFlowAmounts and CFlowDates using the cfamounts function.
CouponRate = [0.06; 0.05; 0.03];
Settle = '03-Jun-1999';
Maturity = ['15-Aug-2000';'15-Dec-2000';'15-Jun-2000'];
Period = [1; 2; 2];  Basis = [1; 0; 0];
[CFlowAmounts, CFlowDates] = cfamounts(...
CouponRate, Settle, Maturity, Period, Basis)
CFlowAmounts = 3×5

   -4.8000    6.0000  106.0000       NaN       NaN
   -2.3352    2.5000    2.5000    2.5000  102.5000
   -1.4011    1.5000    1.5000  101.5000       NaN
CFlowDates = 3×5

      730274      730347      730713         NaN         NaN
      730274      730286      730469      730652      730835
      730274      730286      730469      730652         NaN
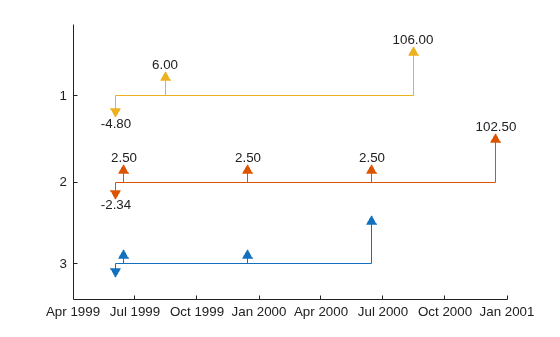
Plot all cash flows on the same axes, and label the first two.
cfplot(CFlowDates, CFlowAmounts, 'ShowAmnt', [1 2])
Group the second and third cash flows.
figure;
cfplot(CFlowDates, CFlowAmounts, 'Groups', {[2 3]}, 'ShowAmnt', 1);

Format the date axis and place ticks on actual cash flow dates.
figure;
cfplot(CFlowDates, CFlowAmounts, 'Groups', {[2 3]}, 'ShowAmnt', 1, ...
'DateFormat', 6, 'DateSpacing', 100);

Stack the cash flow arrows occurring on the same dates.
figure;
cfplot(CFlowDates, CFlowAmounts, 'Groups', {[2 3]}, 'ShowAmnt', 1, ...
'DateFormat', 6, 'DateSpacing', 100, 'Stacked', 1);

Form subplots of multiple groups and add titles using axes handles.
figure;
[h, axes_handle] = cfplot(CFlowDates, CFlowAmounts, ...
'Groups', {[1] [2 3]}, 'ShowAmnt', 1, 'Stacked', 2, ...
'DateSpacing', [1 60 2 100], 'DateFormat', [1 12 2 6]);
title(axes_handle(1), 'Group 1', 'FontWeight', 'bold');
title(axes_handle(2), 'Group 2', 'FontWeight', 'bold');

Define CFlowDates using datetime input and plot the cash flow.
CouponRate = [0.06; 0.05; 0.03];
Settle = '03-Jun-1999';
Maturity = ['15-Aug-2000';'15-Dec-2000';'15-Jun-2000'];
Period = [1; 2; 2];  Basis = [1; 0; 0];
[CFlowAmounts, CFlowDates] = cfamounts(...
CouponRate, Settle, Maturity, Period, Basis);
cfplot(datetime(CFlowDates,'ConvertFrom','datenum','Locale','en_US'), CFlowAmounts, 'ShowAmnt', [1 2])
Define the swap using the swapbyzero (Financial Instruments Toolbox) function.
Settle = datetime(2010,6,8);
RateSpec = intenvset('Rates', [.005 .0075 .01 .014 .02 .025 .03]',...
'StartDates',Settle, 'EndDates',[datetime(2010,12,8),datetime(2011,6,8),datetime(2012,6,8),datetime(2013,6,8),datetime(2015,6,8),datetime(2017,6,8),datetime(2020,6,8)]');
Maturity = datetime(2020,9,15);
LegRate = [.025 50];
LegType = [1 0]; % Fixed/Floating
LatestFloatingRate = .005;
[Price, SwapRate, AI, RecCF, RecCFDates, PayCF,PayCFDates] = ...
swapbyzero(RateSpec, LegRate, Settle, Maturity,'LegType',LegType,...
'LatestFloatingRate',LatestFloatingRate)
Price =
-6.7258
SwapRate =
NaN
AI =
1.4575
RecCF = 1×12

   -1.8219    2.5000    2.5000    2.5000    2.5000    2.5000    2.5000    2.5000    2.5000    2.5000    2.5000  102.5000
RecCFDates = 1×12

      734297      734396      734761      735127      735492      735857      736222      736588      736953      737318      737683      738049
PayCF = 1×12

   -0.3644    0.5000    1.4048    1.9823    2.8436    3.2842    3.8218    4.1733    4.5164    4.4666    4.8068  104.6743
PayCFDates = 1×12

      734297      734396      734761      735127      735492      735857      736222      736588      736953      737318      737683      738049
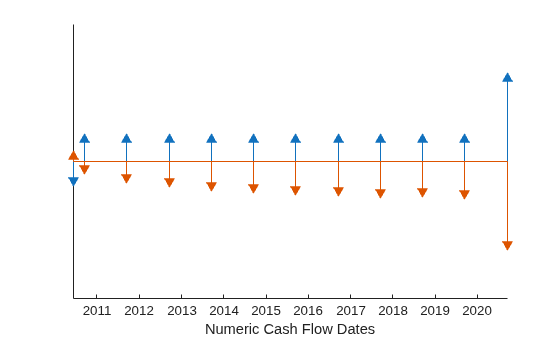
Define CFlowDates and CFlowAmounts for the swap and generate a cash flow plot using cfplot.
CFlowDates = [PayCFDates;RecCFDates];
CFlowAmounts = [-PayCF;RecCF];
cfplot(CFlowDates, CFlowAmounts, 'Groups', {[1 2]});
xlabel('Numeric Cash Flow Dates');
Input Arguments
Name-Value Arguments
Output Arguments
Version History
Introduced in R2013aSee Also
cfamounts | cfdates | swapbyzero (Financial Instruments Toolbox) | datetime

