Main Content

macd

Moving Average Convergence/Divergence (MACD)

Description

[MACDLine,SignalLine] = macd(Data) calculates the Moving Average Convergence/Divergence (MACD) line from the series of data and the nine-period exponential moving average from the MACDLine.

example

Examples

collapse all

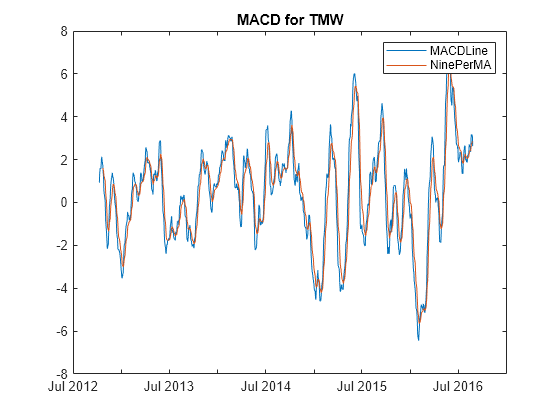
Load the file SimulatedStock.mat, which provides a timetable (TMW) for financial data for TMW stock.

load SimulatedStock.mat
[MACDLine, signalLine]= macd(TMW);
plot(MACDLine.Time,MACDLine.Close,signalLine.Time,signalLine.Close);
legend('MACDLine','NinePerMA')
title('MACD for TMW')

Figure contains an axes object. The axes object with title MACD for TMW contains 2 objects of type line. These objects represent MACDLine, NinePerMA.

Input Arguments

collapse all

Data with high, low, open, close information, specified as a matrix, table, or timetable. For matrix input, Data is an M-by-4 matrix of high, low, opening, and closing prices. Timetables and tables with M rows must contain variables named 'High', 'Low', 'Open', and 'Close' (case insensitive).

Data Types: double | table | timetable

Output Arguments

collapse all

MACD series, returned with the same number of rows (M) and type (matrix, table, or timetable) as the input Data. The MACDLine is calculated by subtracting the 26-period (7.5%) exponential.

Nine-period exponential series, returned with the same number of rows (M) and type (matrix, table, or timetable) as the input Data. The nine-period (20%) exponential moving average of the MACDLine is used as the SignalLine.

More About

collapse all

References

[1] Achelis, S. B. Technical Analysis from A to Z. Second Edition. McGraw-Hill, 1995, pp. 166–168.

Version History

Introduced before R2006a

expand all