This example shows how to create an instrumented MEX function, run a test bench, then view logged results.
Define prototype input arguments.
Generate an instrumented MEX function. Use the -o option to specify the MEX function name. Use the -histogram option to compute histograms.
If you have a MATLAB® Coder™ license, you can also add the -coder option. For example,
buildInstrumentedMex testfft -coder -o testfft_instrumented -args {x,w}
Like the fiaccel function, the buildInstrumentedMex function generates a MEX function. To generate C code, use the MATLAB® Coder™ codegen function.
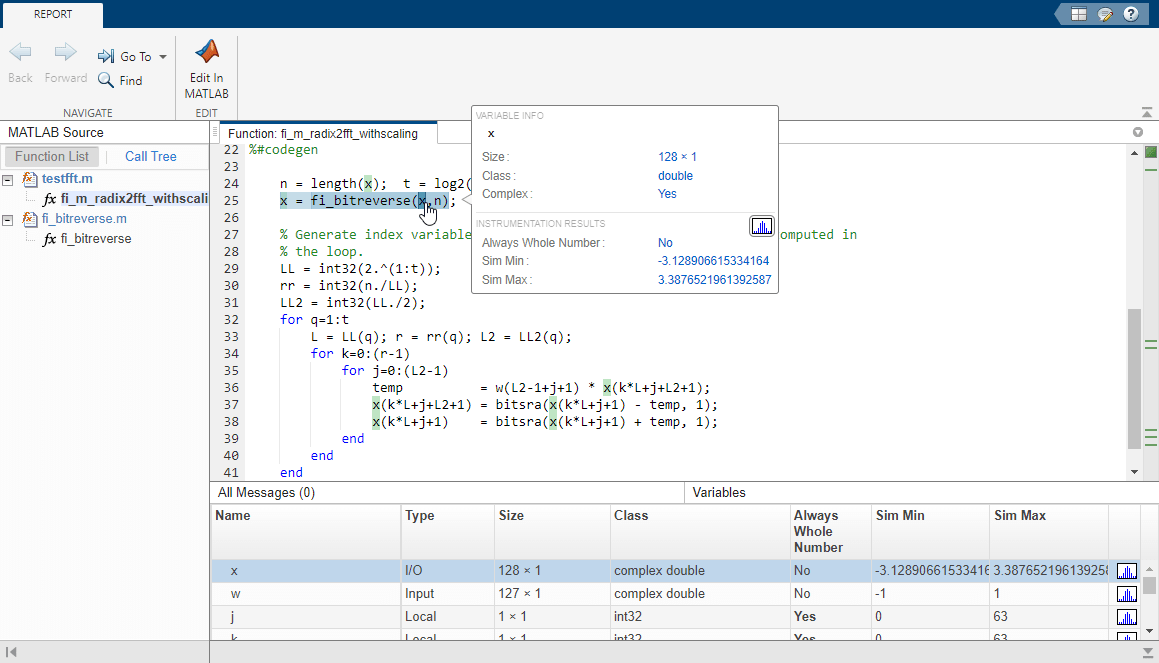
Run a test file to record instrumentation results. Use the showInstrumentedMex function to open the report. To view the simulation minimum and maximum values and whole number status, pause over a variable in the report. You can also see proposed data types for double precision numbers in the table.
Close the histogram display, then use the clearInstrumentationResults function to clear the results log.
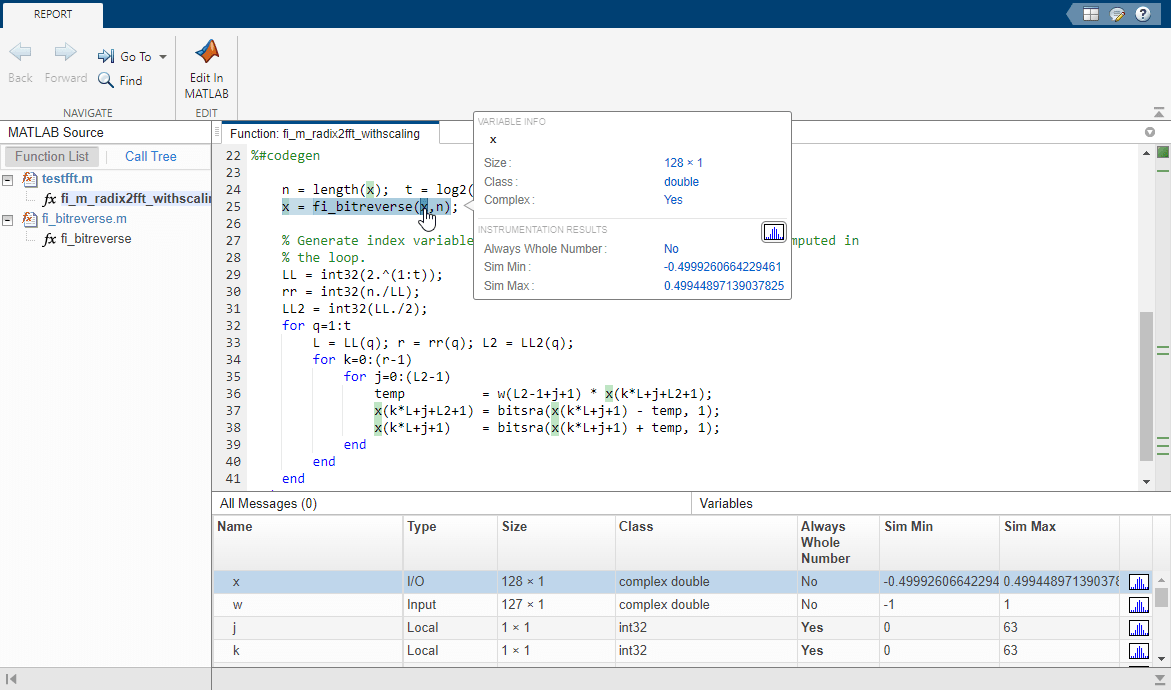
Run a different test bench, then view the new instrumentation results.
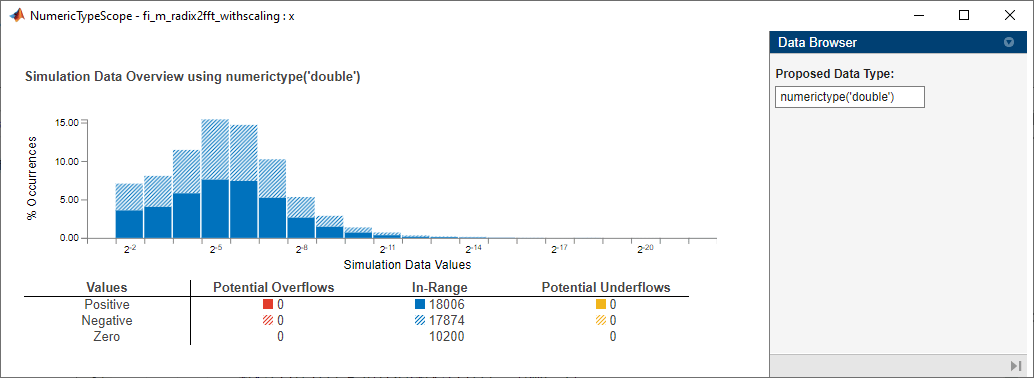
To view the histogram for a variable, click the histogram icon in the Variables tab.
Close the histogram display, then use the clearInstrumentationResults function to clear the results log.
Clear the MEX function.


