Main Content

FCM Data Clustering

Cluster data using fuzzy c-means algorithm in the Live Editor

Since R2025a

Description

The FCM Data Clustering task clusters data using the fuzzy c-means (FCM) algorithm, where each data point belongs to a cluster to a degree that is specified by a membership grade. For example, a data point that lies close to the center of a cluster will have a high degree of membership in that cluster, and another data point that lies far away from the center of a cluster will have a low degree of membership to that cluster. The FCM Data Clustering task automatically generates MATLAB® code for your live script. For more information about Live Editor tasks, see Add Interactive Tasks to a Live Script.

The task returns these output arguments from the fcm function:

  • centers — Cluster centers

  • U — Fuzzy partition matrix indicating the degree of membership of each data point in each cluster

  • objFcn — Objective function values for each clustering iteration

  • info — Detailed clustering results

For more information on the FCM algorithm, see Fuzzy C-Means Clustering.

FCM Data Clustering Live Task showing a sample cluster plot for data with three clusters

Open the Task

To add the FCM Data Clustering task to a live script in the MATLAB Editor:

  • On the Live Editor tab, select Task > FCM Data Clustering.

  • In a code block in the script, enter a relevant keyword, such as fcm or clustering. Select FCM Data Clustering from the suggested command completions.

Examples

expand all

Use the FCM Data Clustering task in the Live Editor to interactively cluster data using the fuzzy c-means (FCM) algorithm. You can experiment with different clustering configurations, such as the number of clusters or distance metric.

Load the five sample data sets. These data sets have different numbers of clusters and data distributions.

load fcmdata

Each data set contains two columns that represent the two features for each data point.

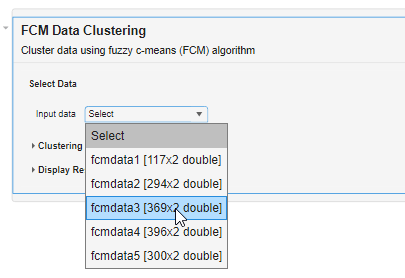
To cluster the data, open the FCM Data Clustering task in the Live Editor. On the Live Editor tab, select Task > FCM Data Clustering.

Select the data to cluster. For this example, under Input data, select fcmdata3.

FCM Data Clustering task showing the Input data drop-down expanded and the pointer over the third entry, fcmdata3.

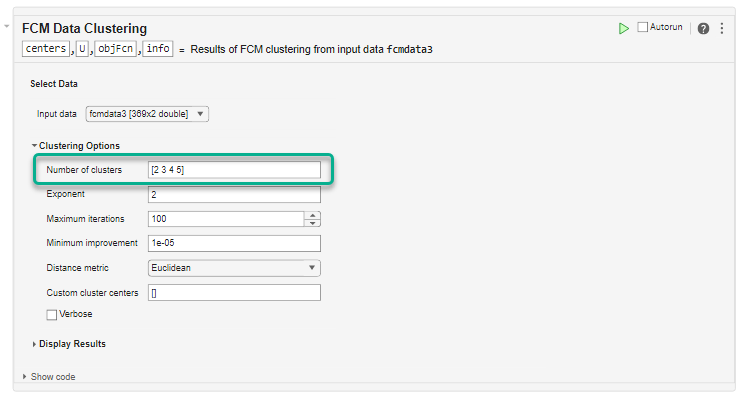
Under Clustering Options, configure the clustering algorithm. For this example, set the Number of clusters to [2 3 4 5]. The task computes clusters for each cluster count in Number of clusters and returns the clustering results for the optimal number of clusters.

Keep the remaining options at their default values.

FCM Data clustering task with the Clustering Options section expanded. The Number of clusters parameter is highlighted with four cluster values, 2, 3, 4, and 5.

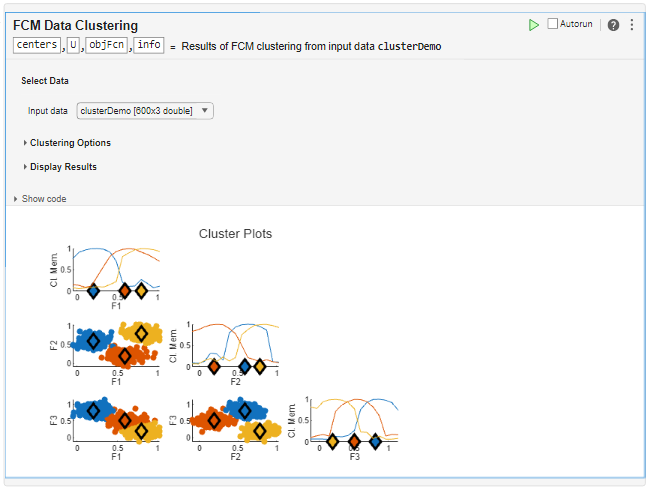
To cluster the data, click the Run current section button . The task clusters the data and plots the results. The task also returns the cluster centers, partition matrix, and objective function values as centers, U, and objFcn, respectively.

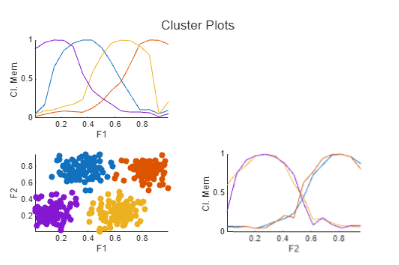
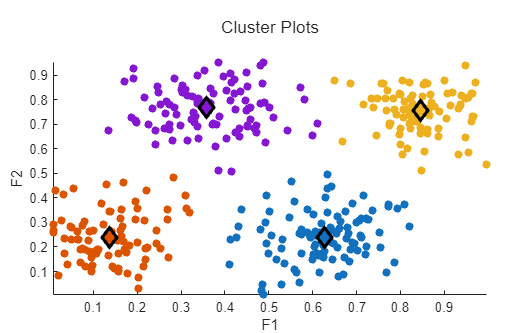
The nondiagonal plot shows each data point classified into the cluster for which it has the highest membership value. The diagonal axes show the marginal cluster membership sets for each feature.

The clustering terminates after around 12 iterations. The output argument objFcn returns the objective function value for each iteration. The final minimum objective function value is around 4.6.

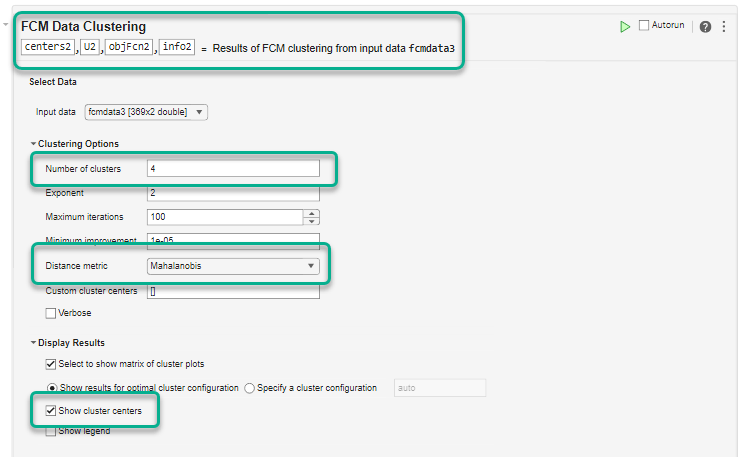
To improve the clustering results and reduce the final objective function value, cluster the data using Mahalanobis distance rather than the default Euclidean distance. The Mahalanobis distance metric generally performs better for nonspherical clusters.

Under Distance metric, select Mahalanobis.

To avoid overwriting the previous clustering results, in the top section of the task, modify the output argument names to centers2, U2, objFcn2, and info2.

Also, since the previous clustering operation found that four clusters was optimal, set Number of clusters to 4.

At the top of the task, the output argument names are changed. Under Clustering Options, Number of clusters is set to 4, and the Distance metric value is Mahalanobis.

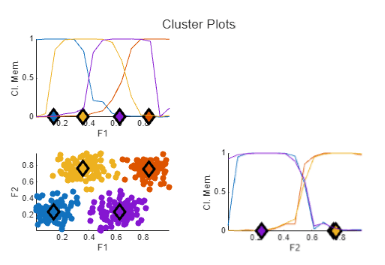
Run the task to cluster the data. The resulting marginal cluster membership values have sharper transitions. Also, the minimum objective function value in objFcn2 is around 0.17, which is significantly lower than the first clustering operation.

To customize the appearance of the cluster plot, specify display options under Display Results. For example:

  • To display the cluster centers, select the Show cluster centers parameter.

  • To suppress the marginal cluster membership plots, clear the Show membership plots parameter.

In the task, the Display Results secton is expanded. In this section, the Show cluster centers parameter is selected and the Show membership plots parameter is cleared.

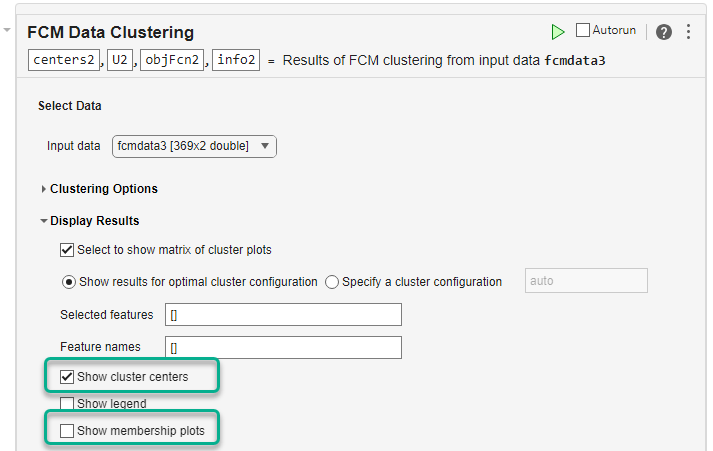
Run the task to cluster the data and display the updated plot. The cluster plot expands to cover the entire plotting area and the cluster centers are displayed as diamonds.

Related Examples

Parameters

expand all

Select Data

Specify input data as a matrix with Nd rows, where Nd is the number of data points. The number of columns in the data is equal to the data dimensionality, that is, the number of features in each data point.

Clustering Options

Number of clusters to create, Nc, specified as one of these values:

  • auto — Cluster the data ten times (Nc = 2 through 11).

  • Integer greater than 1 — Cluster the data once using the specified number of clusters.

  • Vector of integers greater than 1 — Cluster the data multiple times, once for each value in the vector.

When Number of clusters is auto or a vector, the task returns cluster centers for the optimal number of clusters, which it determines using a validity index. The output argument info returns the clustering results for the other values of C.

This parameter controls the amount of fuzzy overlap between clusters, with larger values indicating a greater degree of overlap.

If your data set is wide with significant overlap between potential clusters, then the calculated cluster centers can be very close to each other. In this case, each data point has approximately the same degree of membership in all clusters. To improve your clustering results, decrease this value, which limits the amount of fuzzy overlap during clustering.

Maximum number of iterations for the FCM algorithm, specified as a positive integer.

Minimum improvement in the objective function between two consecutive iterations, specified as a positive scalar. The FCM algorithm stops when the objective function improves by an amount less than Minimum improvement.

Select one of these methods for computing the distance between data points and cluster centers:

  • Euclidean — Compute distance using a Euclidean distance metric, which corresponds to the classical FCM algorithm.

  • Mahalanobis — Compute distance using a Mahalanobis distance metric, which corresponds to the Gustafson-Kessel FCM algorithm.

  • Fuzzy maximum likelihood estimation — Compute distance using fuzzy maximum likelihood estimation (FMLE), which corresponds to the Gath-Geva FCM algorithm.

Since R2026a

Initial fuzzy partition matrix, specified as an Nc-by-Nd matrix, where Nc is the number of clusters and Nd is the number of data points. Element U(i,j) indicates the degree of membership μij of the jth data point in the ith cluster.

When Partition matrix is empty, the FCM algorithm randomly initializes the partition matrix values.

Dependencies

Partition matrix must have the same number of rows as the Custom cluster centers parameter.

  • When the Cluster membership type parameter is Probabilistic, the sum of the membership values for each cluster must be one; that is, the sum of each column of Partition matrix must be one.

  • Partition matrix must have the same number of rows as the Custom cluster centers parameter.

Specify an initial estimate of the cluster centers as an Nc-by-Nf matrix, where Nc is the number of clusters and Nf is the number of data features.

When Custom cluster centers is empty, the FCM algorithm randomly initializes the cluster center values.

Dependencies

Custom cluster centers must have the same number of rows as the Partition matrix parameter.

Select this parameter to display the objective function value during clustering.

Since R2026a

Cluster membership type, specified as one of these values:

  • Probabilistic — For a given data point, the sum of membership values across all clusters is equal to 1. This means that the membership values are interpreted as probabilities, indicating the likelihood that a data point belongs to each cluster.

  • Possibilistic — For a given data point, the sum of membership values across all clusters is not constrained to be 1. Instead, each membership value is independent. Because removing the constraint allows for more flexible membership assignments, this method can better represent noise and outliers in data.

Display Results

Select this parameter to plot the clustering results.

Select this parameter to plot the results for the optimal number of clusters. The cluster plots show results that correspond to the centers and U output arguments.

Dependencies

  • To enable this parameter, select the Select to show matrix of cluster plots parameter.

  • When you select this parameter, the task clears the Specify a cluster configuration parameter.

Select this parameter to plot the results for a specified number of clusters, which you enter in the text box. The cluster plots show results for the corresponding elements of the FuzzyPartitionMatrix and ClusterCenters fields of the info output argument.

Dependencies

  • To enable this parameter, select the Select to show matrix of cluster plots parameter.

  • If the Number of clusters parameter is an integer, you can select only that number of clusters for plotting.

  • When you select this parameter, the task clears the Show results for optimal cluster configuration parameter.

Since R2026a

Features to plot, specified as a vector positive integers. If you do not specify feature to plot, the live task shows plots for all features.

Example: [1 3] shows plots for the features in the first and third columns of the input data.

Dependencies

To enable this parameter, select the Select to show matrix of cluster plots parameter.

Since R2026a

Feature names, specified as a string array. The number feature names must be one of these values:

  • Number of features in the input data specified in the Input data parameter, where each element of Feature names contains the feature name for the corresponding column in the input data matrix.

  • Number of features specified in the Selected features parameter, where each element of Feature names contains the feature name for the corresponding feature index in Selected features.

Dependencies

To enable this parameter, select the Select to show matrix of cluster plots parameter.

Select this parameter to display the cluster centers in the plots.

Dependencies

To enable this parameter, select the Select to show matrix of cluster plots parameter.

Select this parameter to display a legend in the cluster plot.

Dependencies

To enable this parameter, select the Select to show matrix of cluster plots parameter.

Since R2026a

Select this parameter to plot marginal cluster memberships on the diagonal axes.

Dependencies

To enable this parameter, select the Select to show matrix of cluster plots parameter.

Version History

Introduced in R2025a

expand all