pcshowMatchedFeatures
Visualize matched feature points in two point clouds
Syntax
Description
pcshowMatchedFeatures(
displays point clouds, ptCloud1,ptCloud2,matchedPtCloud1,matchedPtCloud2)ptCloud1 and ptCloud2, with
their matched feature points, matchedPtCloud1 and
matchedPtCloud2. The plot is color coded by point cloud and each
connected to the corresponding point in the other point cloud by a line.
ax = pcshowMatchedFeatures(___)Axes object using the input arguments from the
previous syntax.
[___] = pcshowMatchedFeatures(___,
specifies options using one or more name-value pair arguments in addition to any combination
of arguments in previous syntaxes. For example, Name,Value)'Method','montage'
visualizes the point clouds next to each other in the axes.
Examples
This example shows how to visualize matching point cloud features using the pcshowMatchedFeatures function. The example uses features calculated using extractFPFHFeatures function.
Load the required files into the workspace.
load("features1.mat");
load("features2.mat");
load("ptCloud1.mat");
load("ptCloud2.mat");
Match features between two point clouds.
indexPairs = pcmatchfeatures(features1,features2,ptCloud1,ptCloud2);
Create point clouds of only the points in each point cloud with matching features in the other point cloud.
matchedPts1 = select(ptCloud1,indexPairs(:,1));
matchedPts2 = select(ptCloud2,indexPairs(:,2));
Visualize the matches.
pcshowMatchedFeatures(ptCloud1,ptCloud2,matchedPts1,matchedPts2, ...
    "Method","montage")
xlim([-40 210])
ylim([-50 50])
title("Matched Points")
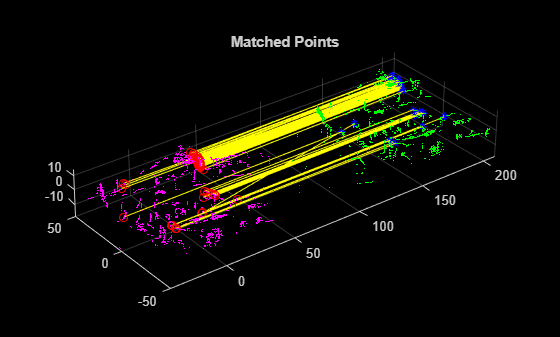
The matched features and point clouds are color coded to improve visualization:
Magenta — Moving point cloud.
Green — Fixed point cloud.
Red circle — Matched points in the moving point cloud.
Blue asterisk — Matched points in the fixed point cloud.
Yellow — Line connecting matched features.
Create a Velodyne® PCAP file reader.
veloReader = velodyneFileReader('lidarData_ConstructionRoad.pcap','HDL32E');
Read the first and fourth scans from the file.
ptCloud1 = readFrame(veloReader,1);
ptCloud2 = readFrame(veloReader,4);
Remove the ground plane from the scans.
maxDistance = 1; % in meters
referenceVector = [0 0 1];
[~,~,selectIdx] = pcfitplane(ptCloud1,maxDistance,referenceVector);
ptCloud1 = select(ptCloud1,selectIdx,'OutputSize','full');
[~,~,selectIdx] = pcfitplane(ptCloud2,maxDistance,referenceVector);
ptCloud2 = select(ptCloud2,selectIdx,'OutputSize','full');
Cluster the point clouds with a minimum of 10 points per cluster using the exhaustive method.
minDistance = 2; % in meters
minPoints = 10;
labels1 = pcsegdist(ptCloud1,minDistance,'NumClusterPoints',minPoints,'Method','exhaustive');
labels2 = pcsegdist(ptCloud2,minDistance,'NumClusterPoints',minPoints,'Method','exhaustive');
Extract eigen-value features and the corresponding segments from each point cloud.
[eigFeatures1,segments1] = extractEigenFeatures(ptCloud1,labels1);
[eigFeatures2,segments2] = extractEigenFeatures(ptCloud2,labels2);
Create matrices of the features and centroids extracted from each point cloud, for matching.
features1 = vertcat(eigFeatures1.Feature);
features2 = vertcat(eigFeatures2.Feature);
centroids1 = vertcat(eigFeatures1.Centroid);
centroids2 = vertcat(eigFeatures2.Centroid);
Find putative feature matches.
indexPairs = pcmatchfeatures(features1,features2, ...
    pointCloud(centroids1),pointCloud(centroids2));
Get the matched segments and features for visualization.
matchedSegments1 = segments1(indexPairs(:,1));
matchedSegments2 = segments2(indexPairs(:,2));
matchedFeatures1 = eigFeatures1(indexPairs(:,1));
matchedFeatures2 = eigFeatures2(indexPairs(:,2));
Visualize the matches.
figure
pcshowMatchedFeatures(matchedSegments1,matchedSegments2,matchedFeatures1,matchedFeatures2)
title('Matched Segments')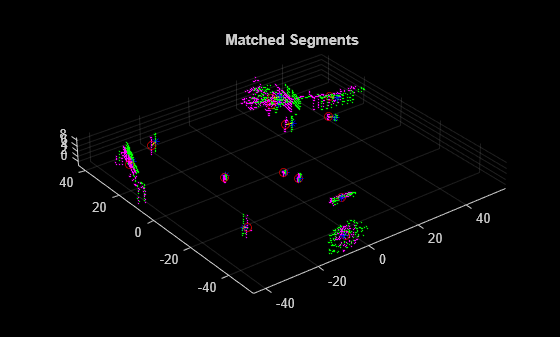
Input Arguments
Name-Value Arguments
Output Arguments
Version History
Introduced in R2020b