datacursormode
Enable data cursor mode
Description
You can use data cursor mode to explore data by interactively creating and editing
data tips. Data tips are small text boxes that display information about individual data
points. Enable or disable data cursor mode, and set other basic options, by using the
datacursormode function. To further control data tip appearance and
behavior, return and use a DataCursorManager object.
Most charts support data tips, including line, bar, histogram, and surface charts. Charts that support data tips typically display the Data tips button in the axes toolbar.
You can also interactively explore data using built-in axes interactions that are enabled by default. For example, you can temporarily display a data tip by pausing on a data point, or you can pin a data tip by clicking on a data point. Built-in interactions do not require you to enable an interaction mode and respond faster than interaction modes. However, you can enable data cursor mode to customize data tip appearance and behavior. For more information about built-in interactions, see Control Chart Interactivity.
Creation
Syntax
Description
datacursormode sets the data cursor
mode for all axes in the current figure. For example, optiondatacursormode
on enables data cursor mode and datacursormode off
disables data cursor mode.
When data cursor mode is enabled, create a data tip using either the cursor or the keyboard.
Cursor — Click a plotted data point. To create multiple data tips, hold the Shift key as you select data points. To move a data tip to another data point, drag the point where the data tip is located.
Keyboard — For some charts, to move the currently selected data tip to another data point, press the up arrow (↑), down arrow (↓), left arrow (←), or right arrow (→) key.
Some built-in interactions remain enabled by default, regardless of the current
interaction mode. To disable built-in data tip interactions that are independent of the
data cursor mode, use the disableDefaultInteractivity function.
datacursormode toggles data cursor mode. For example, if data
cursor mode is disabled, then calling datacursormode enables data
cursor mode.
Input Arguments
Properties
Note
With the exception of UpdateFcn, if you modify any of these
properties of a DataCursorManager object, then MATLAB® enables legacy exploration modes on the figure. For more information, see
enableLegacyExplorationModes.
Data cursor mode state, specified as "on" or
"off", or as numeric or logical 1
(true) or 0 (false). A value
of "on" is equivalent to true, and
"off" is equivalent to false. Thus, you can use
the value of this property as a logical value. The value is stored as an on/off logical
value of type OnOffSwitchState.
Display at closest data point, specified as one of these values:
"on"— Display data tip at the closest data point. The closest data point depends on the type of chart. For example, on a line chart, the closest point is the point that has the smallest Euclidean distance from the specified location."off"— Display data tip at the location you click, even if it is not a data point.
Note
You can achieve the same functionality without entering legacy exploration modes
by setting the DatatipsPlacementMethod property of the
InteractionOptions property of the axes.
Data tip display style, specified as one of these values:
"datatip"— Display data tips as small text boxes attached to data values. To create multiple data tips, hold the Shift key as you select data points. If you disable data cursor mode, existing data tips remain on the chart."window"— Display data tips in a movable window within the figure. When the display style is"window", you can display only one data tip at a time. If you disable data cursor mode, the window closes.
Text interpreter, specified as one of these values:
"tex"— Interpret characters using a subset of TeX markup."latex"— Interpret characters using LaTeX markup."none"— Display literal characters.
TeX Markup
By default, MATLAB supports a subset of TeX markup. Use TeX markup to add superscripts and subscripts, modify the font type and color, and include special characters in the text.
Modifiers remain in effect until the end of the
text. Superscripts and subscripts are an exception because they modify only the next
character or the characters within the curly braces. When you set the interpreter to
"tex", the supported modifiers are as follows.
| Modifier | Description | Example |
|---|---|---|
^{ } | Superscript | "text^{superscript}" |
_{ } | Subscript | "text_{subscript}" |
\bf | Bold font | "\bf text" |
\it | Italic font | "\it text" |
\sl | Oblique font (usually the same as italic font) | "\sl text" |
\rm | Normal font | "\rm text" |
\fontname{ | Font name — Replace
| "\fontname{Courier} text" |
\fontsize{ | Font size — Replace
| "\fontsize{15} text" |
\color{ | Font color — Replace
red, green,
yellow, magenta,
blue, black,
white, gray,
darkGreen, orange, or
lightBlue. | "\color{magenta} text" |
\color[rgb]{specifier} | Custom font color — Replace
| "\color[rgb]{0,0.5,0.5} text" |
This table lists the supported special characters
for the "tex" interpreter.
| Character Sequence | Symbol | Character Sequence | Symbol | Character Sequence | Symbol |
|---|---|---|---|---|---|
| α |
| υ |
| ~ |
| ∠ |
| ϕ |
| ≤ |
|
|
| χ |
| ∞ |
| β |
| ψ |
| ♣ |
| γ |
| ω |
| ♦ |
| δ |
| Γ |
| ♥ |
| ϵ |
| Δ |
| ♠ |
| ζ |
| Θ |
| ↔ |
| η |
| Λ |
| ← |
| θ |
| Ξ |
| ⇐ |
| ϑ |
| Π |
| ↑ |
| ι |
| Σ |
| → |
| κ |
| ϒ |
| ⇒ |
| λ |
| Φ |
| ↓ |
| µ |
| Ψ |
| º |
| ν |
| Ω |
| ± |
| ξ |
| ∀ |
| ≥ |
| π |
| ∃ |
| ∝ |
| ρ |
| ∍ |
| ∂ |
| σ |
| ≅ |
| • |
| ς |
| ≈ |
| ÷ |
| τ |
| ℜ |
| ≠ |
| ≡ |
| ⊕ |
| ℵ |
| ℑ |
| ∪ |
| ℘ |
| ⊗ |
| ⊆ |
| ∅ |
| ∩ |
| ∈ |
| ⊇ |
| ⊃ |
| ⌈ |
| ⊂ |
| ∫ |
| · |
| ο |
| ⌋ |
| ¬ |
| ∇ |
| ⌊ |
| x |
| ... |
| ⊥ |
| √ |
| ´ |
| ∧ |
| ϖ |
| ∅ |
| ⌉ |
| 〉 |
| | |
| ∨ |
| 〈 |
| © |
LaTeX Markup
To use LaTeX markup, set the interpreter to "latex". For inline
mode, surround the markup with single dollar signs ($). For display
mode, surround the markup with double dollar signs
($$).
| LaTeX Mode | Example | Result |
|---|---|---|
| Inline |
"$\int_1^{20} x^2 dx$" |
|
| Display |
"$$\int_1^{20} x^2 dx$$" |
|
The displayed text uses the default LaTeX font style. To change the font style, use LaTeX markup.
The maximum size of the text that you can use with the LaTeX interpreter is 1200 characters. For multiline text, this reduces by about 10 characters per line.
MATLAB supports most standard LaTeX math mode commands. For more information, see Supported LaTeX Commands. For examples that use TeX and LaTeX, see Greek Letters and Special Characters in Chart Text.
Callback function that formats data tip text, specified as [] or
a function handle.
Use this property to format the content of data tips. MATLAB passes two arguments to the callback function:
empty— Empty argument. Replace it with the tilde character (~) in the function to indicate that it is not used.info— Structure containing information about the data tip. Theinfoargument has two fields:TargetandPosition. TheTargetfield contains an object with aDataTipTemplateproperty. ThePositionfield contains the coordinates of the data tip.
The function must be on the MATLAB path or in the current folder. Alternatively, you can select a function that is not on the MATLAB path by selecting Update Function > Choose from File from the data tip context menu.
For more information about callbacks, see Create Callbacks for Graphics Objects.
This property is read-only.
Figure object that you specified when creating the
DataCursorManager object. If you did not specify a figure, then
FigureHandle is the figure that was the current figure when you
created the DataCursorManager object.
Object Functions
Note
If you call this object function for a DataCursorManager object, then
MATLAB enables legacy exploration modes on the figure. For more information, see
enableLegacyExplorationModes.
getCursorInfo | The Calling
Note For some target objects, the
|
Examples
Plot some data and create a DataCursorManager
object.
x = linspace(0,5,30);
y = exp(x);
scatter(x,y)
dcm = datacursormode;
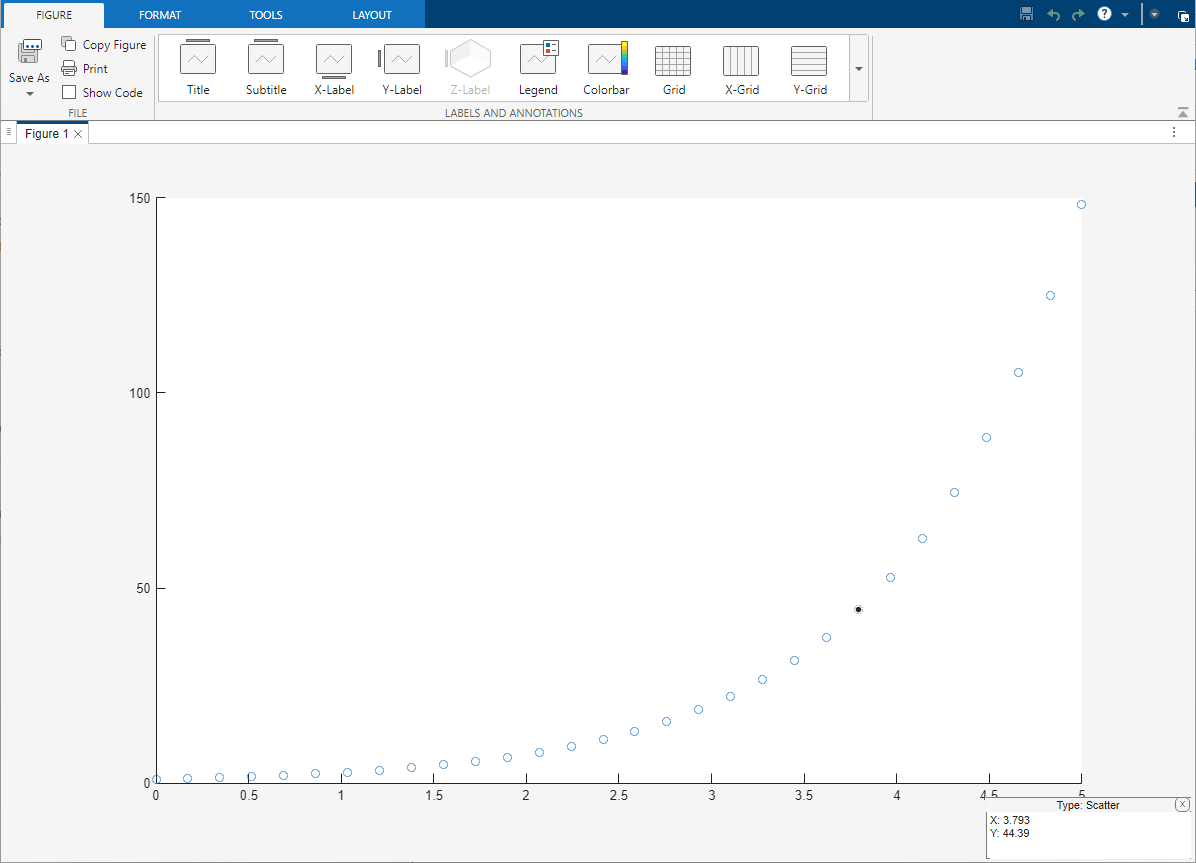
Enable data cursor mode, and display data tip content in a movable window by setting
the DisplayStyle property to "window". Then,
create a data tip by clicking on a data point. You can move the data tip window by
dragging the window heading. Click the Expand axes toolbar button to see the axes toolbar.
dcm.Enable = "on";
dcm.DisplayStyle = "window";
Define a callback function that accepts data tip information and returns customized
text. Return the customized text as a string, in this case containing an ordered pair of
coordinates. Save the function as a program file named
displayCoordinates.m.
function txt = displayCoordinates(~,info)
    x = info.Position(1);
    y = info.Position(2);
    myDatatipText = "(%s, %s)";
    txt = sprintf(myDatatipText, num2str(x), num2str(y));
end
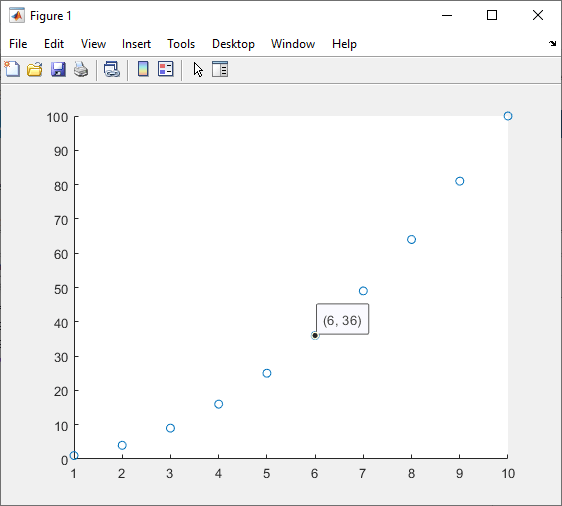
Plot some data, enable data cursor mode, and set the UpdateFcn
property to the callback function.
x = 1:10;
y = x.^2;
scatter(x,y)

dcm = datacursormode;
dcm.Enable = "on";
dcm.UpdateFcn = @displayCoordinates;
Then, create a data tip by clicking on a data point.
Tips
In general, data tips show the coordinates of the selected data point. However, for some types of charts, data tips display specialized information. For example, histograms created using the
histogramfunction display data tips that itemize the observation counts and bin edges.
Alternative Functionality
Axes Toolbar
For some charts, enable data cursor mode by clicking the Data tips button in the axes toolbar.
Programmatic Workflow
To programmatically create and customize data tips, use the datatip and
dataTipTextRow
functions. For more information, see Create Custom Data Tips.