Main Content

imagesc

Display image with scaled colors

Description

example

imagesc(C) displays the data in array C as an image that uses the full range of colors in the colormap. Each element of C specifies the color for one pixel of the image. The resulting image is an m-by-n grid of pixels where m is the number of rows and n is the number of columns in C. The row and column indices of the elements determine the centers of the corresponding pixels.

example

imagesc(x,y,C) specifies the image location. Use x and y to specify the locations of the corners corresponding to C(1,1) and C(m,n). To specify both corners, set x and y as two-element vectors. To specify the first corner and let imagesc determine the other, set x and y as scalar values. The image is stretched and oriented as applicable.

imagesc('CData',C) adds the image to the current axes without replacing existing plots. This syntax is the low-level version of imagesc(C). For more information, see High-Level Versus Low-Level Version.

imagesc('XData',x,'YData',y,'CData',C) specifies the image location. This syntax is the low-level version of imagesc(x,y,C).

imagesc(___,Name,Value) specifies image properties using one or more name-value pair arguments. You can specify name-value pair arguments after any of the input argument combinations in the previous syntaxes. For a list of image properties and descriptions, see Image Properties.

example

imagesc(___,clims) specifies the data values that map to the first and last elements of the colormap. Specify clims as a two-element vector of the form [cmin cmax], where values less than or equal to cmin map to the first color in the colormap and values greater than or equal to cmax map to the last color in the colormap. Specify clims after name-value pair arguments.

imagesc(ax,___) creates the image in the axes specified by ax instead of in the current axes (gca). Specify the axes as the first input argument.

example

im = imagesc(___) returns the Image object created. Use im to set properties of the image after it is created. You can specify this output with any of the input argument combinations in the previous syntaxes.

Examples

collapse all

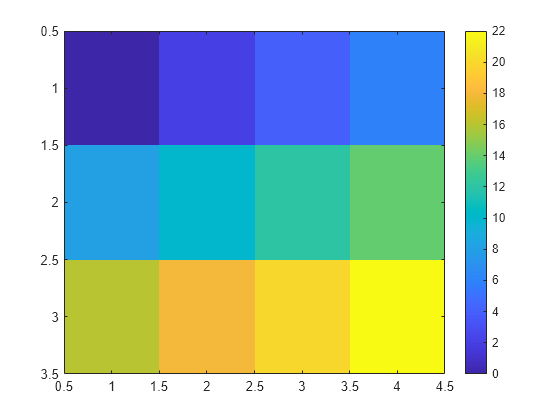
Create matrix C. Display an image of the data in C. Add a colorbar to the graph to show the current colormap. By default, imagesc scales the color limits so that image uses the full range of the colormap, where the smallest value in C maps to the first color in the colormap and the largest value maps to the last color.

C = [0 2 4 6; 8 10 12 14; 16 18 20 22];
imagesc(C)
colorbar

Figure contains an axes object. The axes object contains an object of type image.

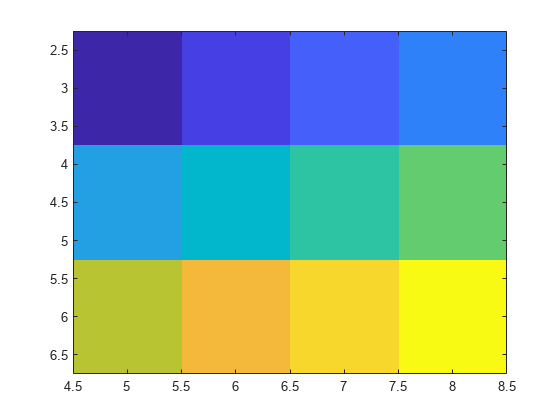
Place the image so that it lies between 5 and 8 on the x-axis and between 3 and 6 on the y-axis.

x = [5 8];
y = [3 6];
C = [0 2 4 6; 8 10 12 14; 16 18 20 22];
imagesc(x,y,C)

Figure contains an axes object. The axes object contains an object of type image.

Notice that the pixel corresponding to C(1,1) is centered over the point (5,3). The pixel corresponding to C(3,4) is centered over the point (8,6). imagesc positions and orients the rest of the image between those two points.

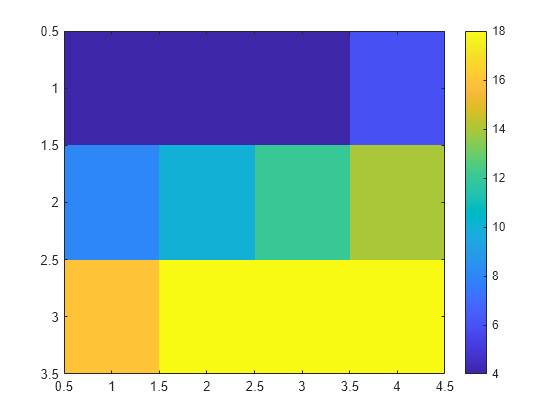
Create C as an array of data values. Create an image of C and set the color limits so that values of 4 or less map to the first color in the colormap and values of 18 or more map to the last color in the colormap. Display a colorbar to show how the data values map into the colormap.

C = [0 2 4 6; 8 10 12 14; 16 18 20 22];
clims = [4 18];
imagesc(C,clims)
colorbar

Figure contains an axes object. The axes object contains an object of type image.

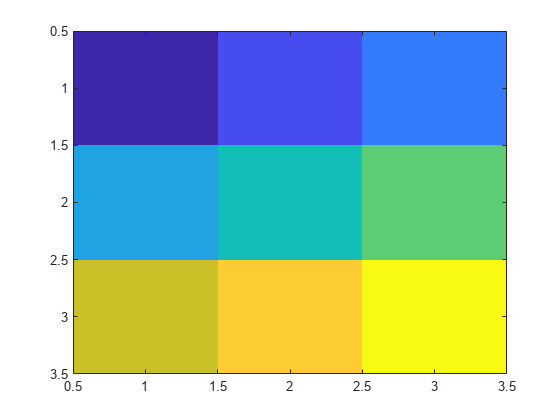
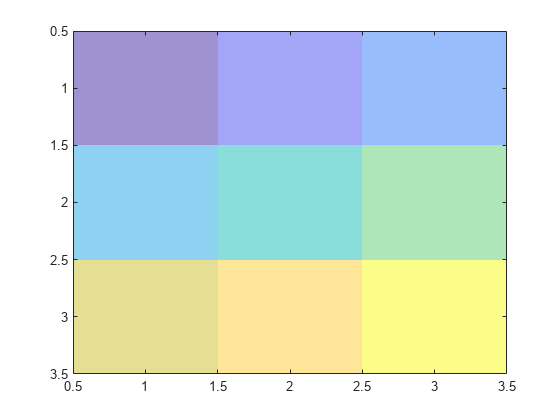
Create an image and return the image object, im. Then, make the image semitransparent by setting the AlphaData property of the image object.

C = [1 2 3; 4 5 6; 7 8 9];
im = imagesc(C);

Figure contains an axes object. The axes object contains an object of type image.

im.AlphaData = .5;

Figure contains an axes object. The axes object contains an object of type image.

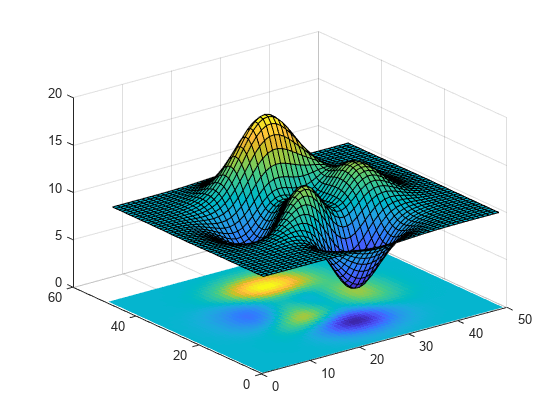
Create a surface plot. Then, add an image under the surface. imagesc displays the image in the xy-plane.

Z = 10 + peaks;
surf(Z)
hold on
imagesc(Z)

Figure contains an axes object. The axes object contains 2 objects of type surface, image.

Input Arguments

collapse all

Image color data, specified as a vector or a matrix. Each element of C defines a color for one pixel of the image. The elements of C map to colors in the colormap of the associated axes. The smallest value in C maps to the first color in the colormap and the largest value maps to the last color. The behavior of NaN elements is not defined.

Note

If you specify C as an m-by-n-by-3 array, then the imagesc function interprets the image as a truecolor (RGB) image. imagesc does not rescale pixel values of truecolor images. Use the rescale function to scale truecolor pixel values before calling imagesc.

To use the low-level version of the imagesc function instead, set the CData property as a name-value pair. For example, imagesc('CData',C).

Data Types: single | double | int8 | int16 | int32 | int64 | uint8 | uint16 | uint32 | uint64 | logical

Placement along the x-axis, specified in one of these forms:

  • Two-element vector — Use the first element as the location for the center of C(1,1) and the second element as the location for the center of C(m,n), where [m,n] = size(C). If C is a 3-D array, then m and n are the first two dimensions. Evenly distribute the centers of the remaining elements of C between those two points.

    The width of each pixel is determined by the expression:

    (x(2)-x(1))/(size(C,2)-1)

    If x(1) > x(2), then the image is flipped left-right.

  • Scalar — Center C(1,1) at this location and each following element one unit apart.

Note

  • If x has more than two elements, imagesc uses the first and last elements and ignores the other elements.

  • To use the low-level version of the imagesc function instead, set the XData property by using a name-value argument. For example, imagesc('XData',x,'YData',y,'CData',C).

  • You cannot interactively pan or zoom outside the x-axis limits or y-axis limits of an image, unless the limits are already set outside the bounds of the image. If the limits are already outside the bounds, there is no such restriction. If other objects (such as a line) occupy the axes and extend beyond the bounds of the image, you can pan or zoom to the bounds of the other objects, but no further.

Data Types: single | double | int8 | int16 | int32 | int64 | uint8 | uint16 | uint32 | uint64 | logical | datetime (since R2023b) | duration (since R2023b) | categorical (since R2023b)

Placement along y-axis, specified in one of these forms:

  • Two-element vector — Use the first element as the location for the center of C(1,1) and the second element as the location for the center of C(m,n), where [m,n] = size(C). If C is a 3-D array, then m and n are the first two dimensions. Evenly distribute the centers of the remaining elements of C between those two points.

    The height of each pixel is determined by the expression:

    (y(2)-y(1))/(size(C,1)-1)

    If y(1) > y(2), then the image is flipped up-down.

  • Scalar — Center C(1,1) at this location and each following element one unit apart.

Note

  • If y has more than two elements, imagesc uses the first and last elements and ignores the other elements.

  • To use the low-level version of the imagesc function instead, set the YData property by using a name-value argument. For example, imagesc('XData',x,'YData',y,'CData',C).

  • You cannot interactively pan or zoom outside the x-axis limits or y-axis limits of an image, unless the limits are already set outside the bounds of the image. If the limits are already outside the bounds, there is no such restriction. If other objects (such as a line) occupy the axes and extend beyond the bounds of the image, you can pan or zoom to the bounds of the other objects, but no further.

Data Types: single | double | int8 | int16 | int32 | int64 | uint8 | uint16 | uint32 | uint64 | logical | datetime (since R2023b) | duration (since R2023b) | categorical (since R2023b)

Color limits, specified as a two-element vector of the form [cmin cmax], where cmax is greater than cmin. Values in C that are less than or equal to cmin map to the first color in the colormap. Values greater than or equal to cmax map to the last color in the colormap. Values between cmin and cmax linearly map to the colormap.

If you specify the color limits, then the imagesc function sets the CLim property of the axes to the values specified. If you do not specify the color limits, then imagesc sets the CLim property of the axes to the minimum and maximum values in C.

Axes object. If you do not specify an Axes object, then imagesc uses the current axes.

Name-Value Arguments

Specify optional pairs of arguments as Name1=Value1,...,NameN=ValueN, where Name is the argument name and Value is the corresponding value. Name-value arguments must appear after other arguments, but the order of the pairs does not matter.

Before R2021a, use commas to separate each name and value, and enclose Name in quotes.

Example: imagesc([1 2 3],'AlphaData',0.5) displays a semitransparent image.

The properties listed here are a subset of image properties. For a complete list, see Image Properties.

Transparency data, specified in one of these forms:

  • Scalar — Use a consistent transparency across the entire image.

  • Array the same size as CData — Use a different transparency value for each image element.

The AlphaDataMapping property controls how MATLAB® interprets the alpha data transparency values.

Example: 0.5

Data Types: single | double | int8 | int16 | int32 | int64 | uint8 | uint16 | uint32 | uint64 | logical

Interpretation of AlphaData values, specified as one of these values:

  • 'none' — Interpret the values as transparency values. A value of 1 or greater is completely opaque, a value of 0 or less is completely transparent, and a value between 0 and 1 is semitransparent.

  • 'scaled' — Map the values into the figure’s alphamap. The minimum and maximum alpha limits of the axes determine the alpha data values that map to the first and last elements in the alphamap, respectively. For example, if the alpha limits are [3 5], then alpha data values less than or equal to 3 map to the first element in the alphamap. Alpha data values greater than or equal to 5 map to the last element in the alphamap. The ALim property of the axes contains the alpha limits. The Alphamap property of the figure contains the alphamap.

  • 'direct' — Interpret the values as indices into the figure’s alphamap. Values with a decimal portion are fixed to the nearest lower integer:

    • If the values are of type double or single, then values of 1 or less map to the first element in the alphamap. Values equal to or greater than the length of the alphamap map to the last element in the alphamap.

    • If the values are of type integer, then values of 0 or less map to the first element in the alphamap. Values equal to or greater than the length of the alphamap map to the last element in the alphamap (or up to the range limits of the type). The integer types are uint8, uint16, uint32, uint64 , int8, int16, int32, and int64.

    • If the values are of type logical, then values of 0 map to the first element in the alphamap and values of 1 map to the second element in the alphamap.

Output Arguments

collapse all

Image object. Use im to set properties of the image after it is created. For a list, see Image Properties.

More About

collapse all

High-Level Versus Low-Level Version

The imagesc function has two versions, the high-level version and the low-level version. If you use imagesc with 'CData' as an input argument, then you are using the low-level version. Otherwise, you are using the high-level version.

The high-level version of imagesc calls newplot before plotting and sets these axes properties:

  • Layer to 'top'. The image is shown in front of any tick marks or grid lines.

  • YDir to 'reverse'. Values along the y-axis increase from top to bottom. To decrease the values from top to bottom, set YDir to 'normal'. This setting reverses both the y-axis and the image.

  • View to [0 90].

The low-level version of the imagesc function does not call newplot and does not set these axes properties.

For both versions, the imagesc function sets:

  • The CData property of the Image object to the values in C.

  • The CDataMapping property of the Image object to 'scaled'.

  • The CLim property of the Axes object to the minimum and maximum values in C, unless you specify the clims input argument.

Tips

  • To read image data into MATLAB from graphics files in various standard formats, such as TIFF, use imread. To write MATLAB image data to graphics files, use imwrite. The imread and imwrite functions support various graphics file formats and compression schemes.

  • To view or set the color limits of the axes, you can use the clim function.

    Before R2022a: Use caxis, which has the same syntaxes and arguments as clim.

Extended Capabilities

Version History

Introduced before R2006a

expand all

See Also

Functions

Properties