pareto
Pareto chart
Syntax
Description
pareto( creates a Pareto chart of
y)y. A Pareto chart is a bar chart with the bars sorted in descending
order, and it includes a line that shows the cumulative distribution. The chart displays the
tallest bars that comprise 95% of the cumulative distribution, up to a maximum of
10 bars. If n bars contain exactly 95% of the
distribution, and n is less than 10, the chart
displays n+1 bars.
The bar labels along the x-axis are the indices to the bar values in
the y vector.
pareto(___, specifies a
threshold value between threshold)0 and 1. The threshold is the
fraction of the cumulative distribution to include in the chart. The chart includes the
tallest bars that comprise that fraction, up to a maximum of 10 bars. If
n bars contain exactly the specified fraction, and n
is less than 10, the chart displays n+1 bars.
charts = pareto(___)Bar and Line objects in an array. You can use the
objects to modify aspects of the Pareto chart by setting properties. For a list of
properties, see Bar Properties and Line Properties.
[charts,ax] = pareto(___) returns an array of two
Axes objects in addition to the objects in the
charts array. You can use these objects to modify aspects of the chart
by setting properties. For a list of properties, see Axes Properties, Bar Properties, and Line Properties.
Examples
Define y as a vector of five numbers that sum to 100, so you can see the relationship between the numbers and the bars in the chart.
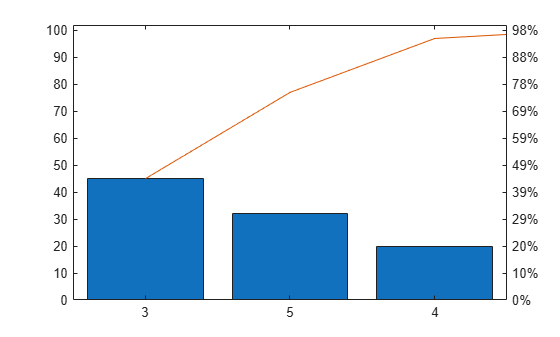
Then, create a Pareto chart of y without specifying the x-coordinates. The x-axis tick labels are the locations of the bar values in y. In this case, y(3) is the largest value, so its bar displays in the left most position, followed by y(5) and y(4). These three bars comprise more than 95% of the cumulative distribution, so they are the only bars shown in the chart.
y = [2 3 45 20 32];
pareto(y)
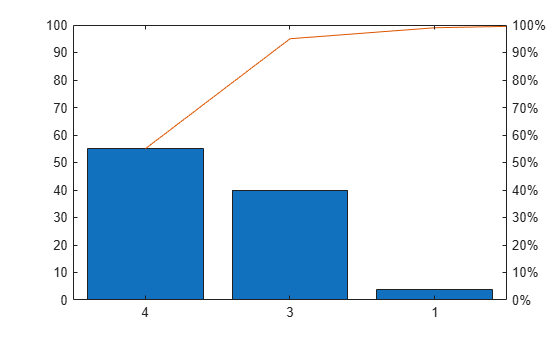
When n of the tallest bars comprise exactly 95% of the cumulative distribution, pareto includes n+1 bars in the chart. For example, define y such that two bars contain exactly 95% of the data. pareto displays the tallest three bars.
y = [4 1 40 55];
pareto(y)
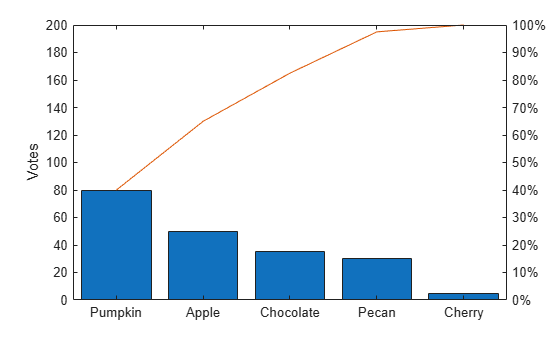
Use a Pareto chart to examine the preferred types of pie in a survey of 200 participants. Define x as a string vector containing five pie flavors, and define y as the number of votes for each flavor. Create a Pareto chart, and include all the values in the cumulative distribution by setting the threshold argument to 1.
x = ["Chocolate" "Apple" "Pecan" "Cherry" "Pumpkin"];
y = [35 50 30 5 80];
pareto(y,x,1)
ylabel('Votes')
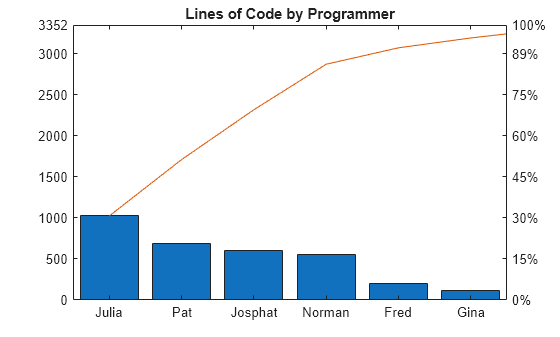
Define x as a string vector containing the names of eight programmers that contributed to a project. Define y as the number of lines of code that each programmer contributed. Display the data in a Pareto chart with a title.
x = ["Fred" "Gina" "Norman" "Josphat" "Julia" "Wally" "Heidi" "Pat"];
y = [200 120 555 608 1024 101 57 687];
pareto(y,x)
title('Lines of Code by Programmer')
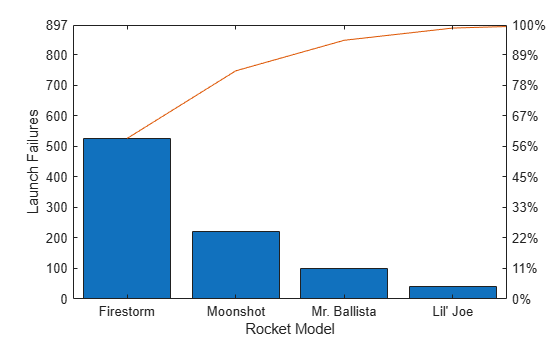
Define x as a categorical vector of the names of five different model rockets manufactured at a particular factory. Define y as the number of rockets that failed to launch from a random sampling within each category. Display the data in a Pareto chart, and add labels to the x- and y-axes.
x = categorical(["Firestorm" "Mr. Ballista" "Moonshot" "Lil' Joe" "Houston"]);
y = [526 100 221 40 10];
pareto(y,x)
xlabel('Rocket Model')
ylabel('Launch Failures')
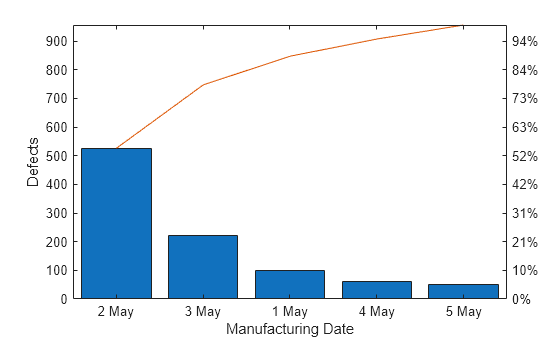
Define x as a datetime vector indicating the manufacturing dates for a particular electronic component. Define y as the number of defects for each batch of components. Display the data in a Pareto chart, and add labels to the x- and y-axes.
x = datetime(2018,5,1:5,'Format','d MMM');
y = [100 526 221 60 49];
pareto(y,x)
xlabel('Manufacturing Date')
ylabel('Defects')
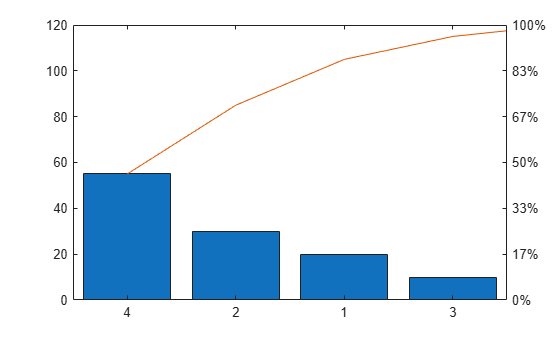
Define y as a vector of five numbers, and create a Pareto chart. Specify return arguments so you can customize aspects of the chart and axes.
y = [20 30 10 55 5];
[charts, ax] = pareto(y);
Use the charts array to change the colors of the Bar and the Line objects. The first element in charts is the Bar object, and the second element is the Line object. Change the bar colors to a shade of purple, and change the line color to a shade of green.
charts(1).FaceColor = [0.50  0.37  0.60];
charts(2).Color = [0 0.50 0.10];

Next, change the color of the left y-axis to match the bars, and change the color of the right y-axis to match the line. The Axes object for the left side is the first element of the ax array. The other Axes object is in the second element of the ax array.
After changing the colors, display the axes grid lines.
ax(1).YColor = [0.50 0.37 0.60];
ax(2).YColor = [0 0.50 0.10];
grid on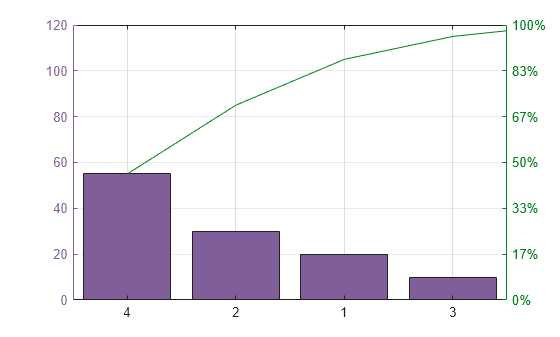
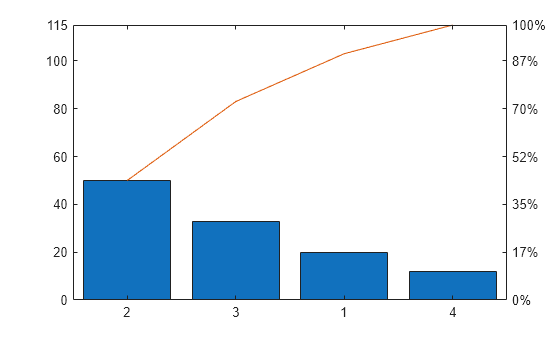
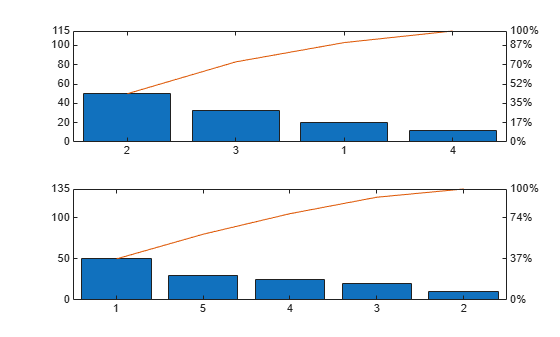
To create multiple charts in a figure, use a tiled chart layout. Call the nexttile function to create an axes object in a tiled chart layout. If there is no layout available, nexttile creates one. Create a Pareto chart by passing the axes to the pareto function as the first argument.
ax1 = nexttile;
pareto(ax1,[20 50 33 12])
Call the nexttile function to add a second axes object to the layout. Then create a second Pareto chart.
ax2 = nexttile;
pareto(ax2,[50 10 20 25 30])
Input Arguments
Extended Capabilities
Version History
Introduced before R2006a