varfun
Apply function to table or timetable variables
Description
B = varfun(func,A)func separately to each variable
of the table or timetable A and returns the results
in the table or timetable B.
The function func must take one input argument and return an array with the
same number of rows each time it is called. The ith value in the
output argument, B{:,i}, is equal to
func(A{:,i}).
B = varfun(func,A,Name=Value)GroupingVariables name-value argument to perform calculations
on groups of data within table variables. For more information about calculations on
groups of data, see Calculations on Groups of Data.
Examples
Apply an element-wise function to the variables of a table.
Create a table that contains numeric variables.
A = table([10.71;-2.05;-0.35;-0.82;1.57],[9.23;3.12;-1.18;0.23;16.41])
A=5×2 table
    Var1     Var2
    _____    _____

    10.71     9.23
    -2.05     3.12
    -0.35    -1.18
    -0.82     0.23
     1.57    16.41
Round the numeric values in A by applying the round function. To specify a function as an input argument to varfun, use the @ symbol. The variable names of the output table are based on the function name and the variable names from the input table.
B = varfun(@round,A)
B=5×2 table
    round_Var1    round_Var2
    __________    __________

        11             9
        -2             3
         0            -1
        -1             0
         2            16
You can apply a function, such as sum or max, that reduces table variables along the first dimension. For example, use varfun to calculate the mean of each variable in a table.
Create a table that contains numeric variables.
A = table([0.71;-2.05;-0.35;-0.82;1.57],[0.23;0.12;-0.18;0.23;0.41])
A=5×2 table
    Var1     Var2
    _____    _____

     0.71     0.23
    -2.05     0.12
    -0.35    -0.18
    -0.82     0.23
     1.57     0.41
Apply the mean function to all the variables of the table. The output table contains the mean value of each variable of the input table.
B = varfun(@mean,A)
B=1×2 table
    mean_Var1    mean_Var2
    _________    _________

     -0.188        0.162
To have varfun return a numeric vector instead of a table, specify the OutputFormat name-value argument as "uniform". To use the "uniform" output format, func must always return a scalar.
B = varfun(@mean,A,OutputFormat="uniform")B = 1×2
-0.1880 0.1620
Create a table that has numeric data variables and a nonnumeric variable that is a grouping variable. Then perform a calculation on each group within the numeric variables.
Read data from a CSV (comma-separated values) file into a table. The sample file contains test scores for 10 students from two different schools.
scores = readtable("testScores.csv",TextType="string");
scores.School = categorical(scores.School)
scores=10×5 table
     LastName       School      Test1    Test2    Test3
    __________    __________    _____    _____    _____

    "Jeong"       XYZ School     90       87       93
    "Collins"     XYZ School     87       85       83
    "Torres"      XYZ School     86       85       88
    "Phillips"    ABC School     75       80       72
    "Ling"        ABC School     89       86       87
    "Ramirez"     ABC School     96       92       98
    "Lee"         XYZ School     78       75       77
    "Walker"      ABC School     91       94       92
    "Garcia"      ABC School     86       83       85
    "Chang"       XYZ School     79       76       82
Calculate the mean score for each test by school. The variables Test1, Test2, and Test3 are the numeric data variables. The School variable is the grouping variable. When you specify a grouping variable, its unique values define groups that corresponding values in the data variables belong to.
vars = ["Test1" "Test2" "Test3"];
meanScoresBySchool = varfun(@mean, ...
                            scores, ...
                            InputVariables=vars, ...
                            GroupingVariables="School")
meanScoresBySchool=2×5 table
      School      GroupCount    mean_Test1    mean_Test2    mean_Test3
    __________    __________    __________    __________    __________

    ABC School        5            87.4            87          86.8
    XYZ School        5              84          81.6          84.6
The output table includes a variable named GroupCount to indicate the number of rows from the input table in that group.
Create a timetable containing sample data. The row times of the timetable can define groups because row times can be duplicates.
Timestamps = datetime(2023,1,1)+days([0 1 1 2 3 3])';
A = timetable(Timestamps, ...
              [0.71;-2.05;-0.35;-0.82;1.57;0.09], ...
              [0.23;0.12;-0.18;0.23;0.41;0.02], ...
              VariableNames=["x" "y"])
A=6×2 timetable
    Timestamps       x        y
    ___________    _____    _____

    01-Jan-2023     0.71     0.23
    02-Jan-2023    -2.05     0.12
    02-Jan-2023    -0.35    -0.18
    03-Jan-2023    -0.82     0.23
    04-Jan-2023     1.57     0.41
    04-Jan-2023     0.09     0.02
Compute the mean values of the variables in the timetable by day. Specify the vector of row times as the grouping variable. The output B is a timetable because the input A is a timetable. When you specify the vector of row times as the grouping variable, you cannot specify any variable as another grouping variable.
B = varfun(@mean,A,GroupingVariables="Timestamps")B=4×3 timetable
Timestamps GroupCount mean_x mean_y
___________ __________ ______ ______
01-Jan-2023 1 0.71 0.23
02-Jan-2023 2 -1.2 -0.03
03-Jan-2023 1 -0.82 0.23
04-Jan-2023 2 0.83 0.215
To pass optional arguments when you apply a function, wrap the function call in an anonymous function.
Create a table that contains numeric variables. Assign NaN to some elements of the table.
A = table([10.71;-2.05;NaN;-0.82;1.57],[9.23;NaN;-1.18;0.23;16.41])
A=5×2 table
    Var1     Var2
    _____    _____

    10.71     9.23
    -2.05      NaN
      NaN    -1.18
    -0.82     0.23
     1.57    16.41
By default, the mean function returns NaN when input arrays have NaNs.
B = varfun(@mean,A)
B=1×2 table
    mean_Var1    mean_Var2
    _________    _________

       NaN          NaN
To omit NaNs when you apply mean, specify the "omitnan" option. To use this option when you apply mean, wrap a call that specifies "omitnan" in an anonymous function.
func = @(x) mean(x,"omitnan");Calculate the mean values with "omitnan" by applying the anonymous function.
C = varfun(func,A)
C=1×2 table
    Fun_Var1    Fun_Var2
    ________    ________

     2.3525      6.1725
Input Arguments
Function, specified as a function handle. You can specify a handle for an existing function, define the function in a file, or specify an anonymous function. The function takes one input argument and must have a syntax in this form:
result = f(arg)
To call f on the variables of A,
specify func as shown in this call to
varfun.
func = @f;
B = varfun(func,A);
For every variable in A, varfun
calls func on that variable, and then assigns the output
of func as the corresponding variable in output
B.
Some further considerations:
The function that
funcrepresents can have other syntaxes with additional optional arguments. But whenvarfuncalls the function, it calls the syntax that has only one input argument.For example, the
meanfunction has syntaxes that specify optional arguments, such as"omitnan". But if you specifyfuncas@mean, thenvarfuncallsmeanusing themean(arg)syntax.To call a function with optional arguments, wrap it in an anonymous function. For example, to call
meanwith the"omitnan"option, specifyfuncas@(x) mean(x,"omitnan").If
funcreturns an array with a different number of rows each time it is called, then specify theOutputFormatname-value argument as"cell". Otherwise,funcmust return an array with the same number of rows each time it is called.If
funccorresponds to more than one function file (that is, iffuncrepresents a set of overloaded functions), MATLAB® determines which function to call based on the class of the input arguments.
Example: B = varfun(@mean,A) calculates the mean value
of an input.
Example: B = varfun(@(x) x.^2,A) calculates the square of each element of an
input.
Example: B = varfun(@(x) mean(x,"omitnan"),A) calls
mean with the "omitnan" option
specified.
Input table, specified as a table or timetable.
Name-Value Arguments
Specify optional pairs of arguments as
Name1=Value1,...,NameN=ValueN, where Name is
the argument name and Value is the corresponding value.
Name-value arguments must appear after other arguments, but the order of the
pairs does not matter.
Example: B = varfun(func,A,InputVariables=["Var2" "Var3"]) uses
only the variables named Var2 and Var3 in
A as the inputs to func.
Variables of A to pass to func,
specified using one of the indexing schemes from this table.
| Indexing Scheme | Examples |
|---|---|
Variable names:
|
|
Variable index:
|
|
Function handle:
|
|
Example: B = varfun(func,A,InputVariables=[1 3 4])
uses only the first, third, and fourth variables in A
as the inputs to func.
Example: B =
varfun(func,A,InputVariables=@isnumeric) uses only the
numeric variables in A as the inputs to
func.
Variables of A to use as grouping variables,
specified using one of the indexing schemes from this table.
| Indexing Scheme | Examples |
|---|---|
Variable names:
|
|
Variable index:
|
|
The unique values in the grouping variables define groups. Rows in
A where the grouping variables have the same
values belong to the same group. varfun applies
func to each group of rows within each of the
remaining variables of A, rather than to entire
variables. For more information on calculations using grouping
variables, see Calculations on Groups of Data.
Grouping variables can have any of the data types listed in this table.
Values That Specify Groups | Data Type of Grouping Variable |
|---|---|
Numbers | Numeric or logical vector |
Text | String array or cell array of character vectors |
Dates and times |
|
Categories |
|
Bins | Vector of binned values, created by binning a
continuous distribution of numeric,
|
Many data types have ways to represent missing values, such as
NaNs, NaTs, undefined
categorical values, or missing strings. If any
grouping variable has a data type that can represent missing values,
then rows where missing values occur in that grouping variable do not
belong to any group and are excluded from the output.
To include rows where the grouping variables have missing values,
consider using the groupsummary function instead.
Row labels can be grouping variables. You can group on row labels
alone, on one or more variables in A, or on row
labels and variables together.
If
Ais a table, then the labels are row names.If
Ais a timetable, then the labels are row times.
The output B has one row for each group of rows in
the input A. If B is a table or
timetable, then B has:
Variables corresponding to the input table variables that
funcwas applied toVariables corresponding to the grouping variables
A new variable,
GroupCount, whose values are the number of rows of the inputAthat are in each group
If B is a timetable, then B also has:
Row times, where the first row time from each group of rows in
Ais the corresponding row time inB. To returnBas a table without row times, specifyOutputFormatas"table".
Example: B = varfun(func,A,GroupingVariables="Var3")
uses the variable named Var3 in A
as a grouping variable.
Example: B = varfun(func,A,GroupingVariables=["Var3"
"Var4"]) uses the variables named Var3
and Var4 in A as grouping
variables.
Example: B = varfun(func,A,GroupingVariables=[3 4])
uses the third and fourth variables in A as grouping
variables.
Format of B, specified as one of the values in this table.
|
|
|
If |
|
If
|
|
|
|
|
Example: B = varfun(func,A,OutputFormat="uniform")
returns the output as a vector.
Function to call if func fails, specified as a
function handle. If func throws an error, then the
error handler function specified by ErrorHandler
catches the error and takes the specified action.
The error handler function must meet these requirements:
The definition of the error handler function must specify that it returns output arguments that match the number and data types of the output arguments of
func.When called, the error handler function can either throw an error or return output arguments. But even if the error handler always throws an error, its definition must specify that it returns the same types and number of output arguments as
func.The error handler function cannot be an anonymous function.
Instead, write it as a local function. You can even define a local function in a script. You do not have to write the local function in a separate file.
If you do not specify ErrorHandler, then
varfun rethrows the error that it caught from
func.
The first input argument of the error handler is a structure with these fields:
cause—MExceptionobject that contains information about the error (since R2024a)index— Index of the variable where the error occurredname— Name of the variable where the error occurred
The remaining input arguments to the error handler are the input
arguments for the call to func that made
func throw the error.
For example, suppose that func returns two doubles
as output arguments. You can specify the error handler as a function
that raises a warning and returns two output
arguments.
function [A,B] = errorFunc(S,varargin)
    warning(S.cause.identifier,S.cause.message);
    A = NaN;
    B = NaN;
end
In releases before R2024a, the first input argument of the error handler is a structure with these fields:
identifier— Error identifiermessage— Error message textindex— Index of the variable where the error occurredname— Name of the variable where the error occurred
Example: B = varfun(func,A,ErrorHandler=@errorFunc)
specifies errorFunc as the error
handler.
Output Arguments
Output values, returned as a table, timetable, cell array, or vector.
If B is a table or timetable, then it can store metadata such as
descriptions, variable units, variable names, and row names. For more information, see
the Properties sections of table or timetable.
To return B as a cell array or vector, specify the
OutputFormat name-value argument.
More About
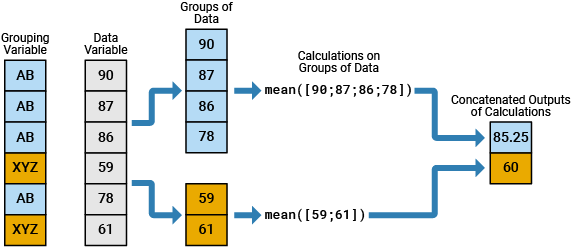
In data analysis, you commonly perform calculations on groups of data. For such calculations, you split one or more data variables into groups of data, perform a calculation on each group, and combine the results into one or more output variables. You can specify the groups using one or more grouping variables. The unique values in the grouping variables define the groups that the corresponding values of the data variables belong to.
For example, the diagram shows a simple grouped calculation that splits a
6-by-1 numeric vector into two groups of data, calculates the mean of each
group, and then combines the outputs into a 2-by-1 numeric vector. The
6-by-1 grouping variable has two unique values, AB and
XYZ.
You can specify grouping variables that have numbers, text, dates and times, categories, or bins.
Extended Capabilities
The
varfun function supports tall arrays with the following usage
notes and limitations:
The
funcinput must always return a tall array.Supported name-value arguments are:
InputVariables— Value cannot be a function handle.OutputFormat
When the input array is a tall timetable and
OutputFormatis"timetable"or"auto", the specified function must return an array with the same size in the first dimension as the input. SpecifyOutputFormatas"table"when the input function is a reduction function such asmean.
For more information, see Tall Arrays.
Usage notes and limitations:
The function handle input,
func, must be constant.While function handles can be inputs to
varfunitself, they cannot be inputs to your entry point functions. Specifyfuncwithin the code meant for code generation. For more information, see Function Handle Limitations for Code Generation (MATLAB Coder).The values for all name-value arguments must be constant.
The values of the
InputVariablesandGroupingVariablesname-value arguments do not support pattern expressions.The
ErrorHandlername-value argument is not supported for code generation.Variable-size input arguments are not supported.
Grouping variables cannot have duplicate values in generated code.
You cannot specify
OutputFormatas"cell"if you specify theGroupingVariablesname-value argument and the function returns a different data type for each variable specified byInputVariables.If the input is a timetable and you specify
GroupingVariables, then the output is always an irregular timetable.If you specify groups and the number of groups is not known at compile time, and that number is zero, then empty double variables in the output might have sizes of 1-by-0 in generated code. In MATLAB, such variables have sizes of 0-by-0.
Refer to the usage notes and limitations in the C/C++ Code Generation section. The same usage notes and limitations apply to GPU code generation.
Thread-Based Environment
Run code in the background using MATLAB® backgroundPool or accelerate code with Parallel Computing Toolbox™ ThreadPool.
Version History
Introduced in R2013bTo return an output whose data type matches the data type of the input, specify
the OutputFormat name-value argument as
"auto". This value is the default value.
See Also
rowfun | cellfun | structfun | arrayfun | findgroups | splitapply | groupsummary | convertvars | vartype
MATLAB Command
You clicked a link that corresponds to this MATLAB command:
Run the command by entering it in the MATLAB Command Window. Web browsers do not support MATLAB commands.
Select a Web Site
Choose a web site to get translated content where available and see local events and offers. Based on your location, we recommend that you select: .
You can also select a web site from the following list
How to Get Best Site Performance
Select the China site (in Chinese or English) for best site performance. Other MathWorks country sites are not optimized for visits from your location.
Americas
- América Latina (Español)
- Canada (English)
- United States (English)
Europe
- Belgium (English)
- Denmark (English)
- Deutschland (Deutsch)
- España (Español)
- Finland (English)
- France (Français)
- Ireland (English)
- Italia (Italiano)
- Luxembourg (English)
- Netherlands (English)
- Norway (English)
- Österreich (Deutsch)
- Portugal (English)
- Sweden (English)
- Switzerland
- United Kingdom (English)