uigauge
Create gauge component
Syntax
Description
g = uigaugeGauge object. MATLAB® calls the uifigure function to create the
figure.
g = uigauge(style)"circular", "linear",
"ninetydegree", or "semicircular".
g = uigauge(___,Name,Value)uigauge("Value",10) creates a gauge with a value of 10.
Examples
Create a circular gauge in a UI figure.
fig = uifigure("Position",[100 100 300 300]);
cg = uigauge(fig);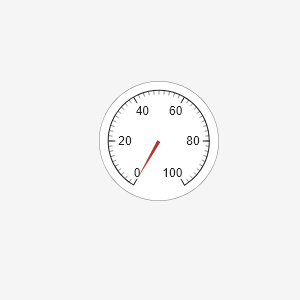
Create a UI figure with a 2-by-3 grid layout manager. Create four gauges with different styles and specify the grid layout manager as the parent container for each of the gauges. Lay out the linear gauge to span the entire bottom row of the grid.
fig = uifigure("Position",[100 100 470 220]);
g = uigridlayout(fig,[2 3]);
g.RowHeight = {'1x','fit'};
cg = uigauge(g);
ng = uigauge(g,"ninetydegree");
sg = uigauge(g,"semicircular");
lg = uigauge(g,"linear");
lg.Layout.Column = [1 3];

Create a circular gauge in a UI figure.
fig = uifigure("Position",[100 100 300 300]);
cg = uigauge(fig);
Specify the gauge limits and value.
cg.Limits = [-50 50];
cg.Value = 20;

Access the values of the major tick marks of the gauge.
mt = cg.MajorTicks
mt = 1×6

   -50   -30   -10    10    30    50
Create a vertical linear gauge in a UI figure.
fig = uifigure("Position",[100 100 300 300]);
lg = uigauge(fig,"linear","Orientation","vertical");
Create a ninety-degree gauge in a UI figure.
fig = uifigure("Position",[100 100 300 300]);
ng = uigauge(fig,"ninetydegree");
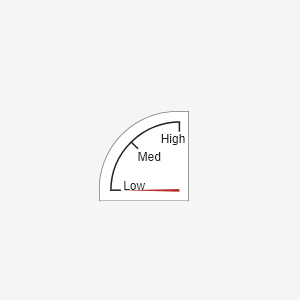
Customize the gauge appearance by changing the number of major ticks, specifying tick labels that correspond to the major ticks, and removing minor ticks.
ng.MajorTicks = 0:50:100;
ng.MajorTickLabels = ["Low","Med","High"];
ng.MinorTicks = [];
Create a semicircular gauge in a UI figure.
fig = uifigure("Position",[100 100 300 300]);
sg = uigauge(fig,"semicircular");
Change the colors of the high gauge values by setting the ScaleColors and ScaleColorLimits properties.
sg.ScaleColors = ["yellow","red"];
sg.ScaleColorLimits = [60 80; 80 100];

Input Arguments
Parent container, specified as a Figure object or
one of its child containers: Tab, Panel, ButtonGroup, or
GridLayout. If you do not specify a parent
container, MATLAB calls the uifigure function to create a new Figure object that serves as the parent container.
Style of gauge, specified as one of these values:
| Style | Appearance |
|---|---|
"circular" | 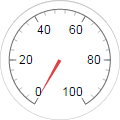 |
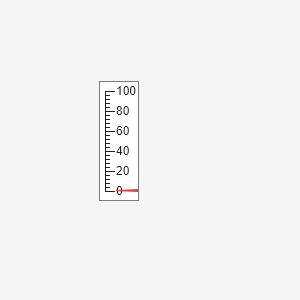
"linear" | |
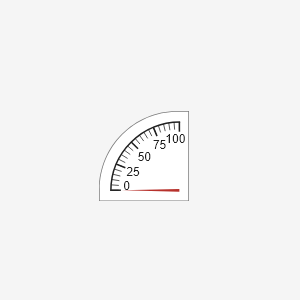
"ninetydegree" |  |
"semicircular" | 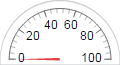 |