phaseNoiseMeasure
R2026bMeasure and plot phase noise profile of input signal
Syntax
Description
PNMeasure = phaseNoiseMeasure(Xin,Yin,RBW,FrOffset,PlotOption,tag,Name,Value)
The function also plots phase noise profile at the specified frequency offset points
when you specify the PlotOption argument as
'on'.
PNMeasure = phaseNoiseMeasure(___,PNTarget,Name=Value)PlotOption argument to 'on' to plot and compare
the measured phase noise profile to the target profile.
[
additionally returns the phase noise waveform data represented by the frequency offset
vector and the corresponding phase noise vector.PNMeasure,GenFrOffset,GenPN] = phaseNoiseMeasure(___)
Examples
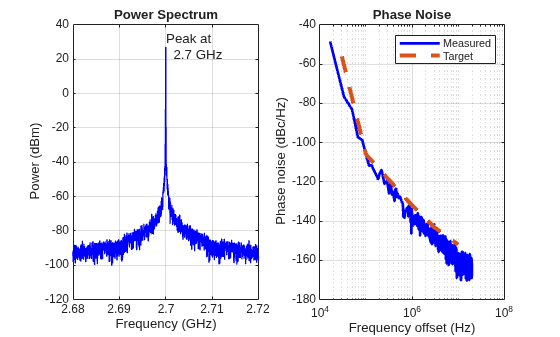
Load the power spectrum data (frequency and power vectors) of the signal obtained from spectrum analysis attached with this example.
load frequency.mat;
load corresponding_power.mat;
Set the resolution bandwidth of the spectrum analysis to 25 kHz. The target phase noise profile corresponding to the frequency offset points is:
Frequency Offset | Target Phase Noise (dBc/Hz) |
|
|
|
|
|
|
|
|
|
|
rbw = 25e3;
FrOffset = [30e3 100e3 1e6 3e6 10e6];
PNTarget = [-56 -106 -132 -143 -152];
Use the phaseNoiseMeasure function to measure and plot the phase noise profile.
PNMeasure = phaseNoiseMeasure(f1,p1,rbw,FrOffset,'on','Phase noise', PNTarget)
PNMeasure = 1×5

  -70.8795 -106.2594 -136.6468 -147.3779 -157.0967
Load the time domain signal represented by the time and signal value vectors attached with this example.
load time_1.mat;
load signal_1.mat;
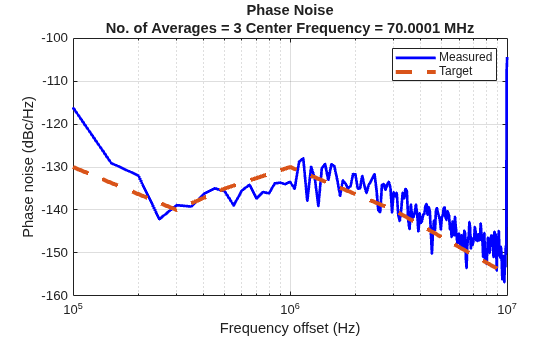
Set the resolution bandwidth of the spectrum analysis to 75 kHz. The target phase noise profile corresponding to the frequency offset points is:
Frequency Offset (Hz) | Target Phase Noise (dBc/Hz) |
|
|
|
|
|
|
|
|
|
|
|
|
rbw = 75e3;
FrOffset = [100e3 300e3 500e3 1e6 3e6 10e6];
PNTarget = [-130 -140 -135 -130 -140 -155];
Use the phaseNoiseMeasure function to measure and plot the phase noise profile.
[PNMeasure] = phaseNoiseMeasure(t,x,rbw,FrOffset,'on','Phase noise',PNTarget,Type='Time',Histogram='on')
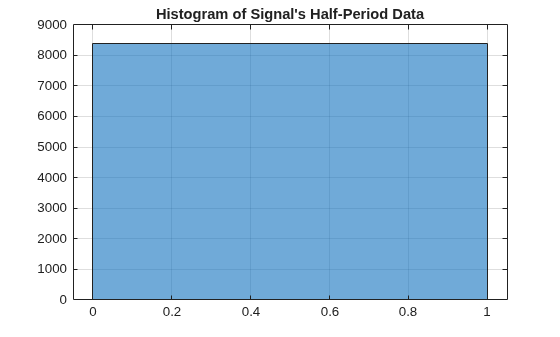
PNMeasure = 1×6

 -116.0947 -138.8840 -135.6692 -133.4506 -135.8644 -104.3224
Load the measured zero-crossing timestamps from the phase_noise_zc_data.mat file attached with this example.
data = load("phase_noise_zc_data.mat");
zcData = unique(data.out.simout.Data);
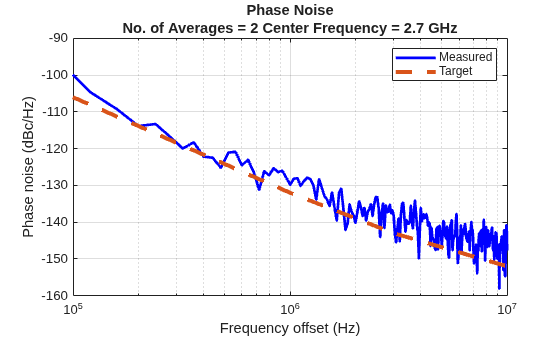
Set the resolution bandwidth of the spectrum analysis to 60 kHz. The target phase noise profile corresponding to the frequency offset points is:
Frequency Offset (Hz) | target Phase Noise (dBc/Hz) |
|
|
|
|
|
|
|
|
rbw = 60e3;
FrOffset = [100e3 1e6 3e6 10e6];
PNTarget = [-106 -132 -143 -152];
Use the phaseNoiseMeasure function to measure and plot the phase noise profile.
[PNMeasure] = phaseNoiseMeasure(zcData,[],rbw,FrOffset,'on','Phase noise',PNTarget,Type='ZeroCrossing')
PNMeasure = 1×4

  -99.3343 -129.8329 -138.1230 -147.6752
Input Arguments
Name-Value Arguments
Output Arguments
Version History
Introduced in R2020a

