MATLAB-Based Eye Analysis in Cadence ADE
This example shows how to embed MATLAB expression-based analysis inside Cadence® ADE simulations using Mixed-Signal Blockset™ functions. During ADE runs, a headless MATLAB session executes in the background to extract waveform data and process it to perform eye analysis. As soon as data becomes available, MATLAB pops up figure windows that visualize the eye diagram in real time. Additionally, the workflow can save the raw waveform data (time and amplitude arrays) into the Cadence Maestro documents folder per data point, enabling traceability and offline post-processing. Computed metrics (e.g., eye width and eye height) are returned to ADE for corner/sweep reporting.
Prerequisites
To run this example you need:
• Cadence ADE environment configured for your design.
• MATLAB with Mixed-Signal Blockset installed and linked to Cadence ADE.
• Helper function 'eyeAnalysis' on the MATLAB path.
• Valid analysis type(i.e. 'tran') and net names (e.g., /o1) available in ADE simulation setup.
Configure Outputs in Cadence ADE
In ADE, define measurement entries under Outputs Setup. Add a MATLAB-expression output named like 'Eye' using the following expression:
eyeAnalysis('/o1', SymbolTime=1.6667e-9, SymbolThresholds=0.5, EyeWidth=true, PlotEye=true)
Outputs Setup entry :
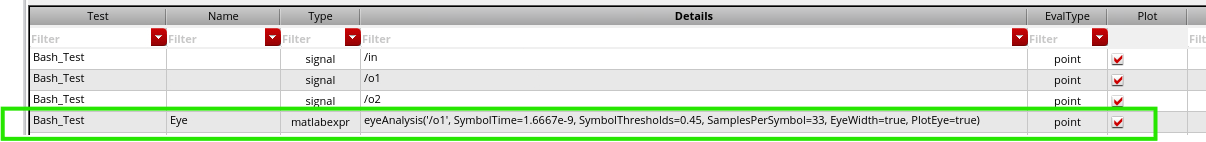
When defining MATLAB expressions in ADE, set EvalType = point. This ensures that the MATLAB expression is evaluated for each simulation point individually. This guarantees accurate metric computation per corner or sweep and avoids aggregated or incomplete evaluations that could occur with other eval types (e.g., sweep or global). It also enables real-time plotting and data saving for each point.
Perform eye analysis in MATLAB
The helper function eyeAnalysis attached with this example uses Mixed-Signal Blockset™ capabilities to process transient waveform data from Cadence simulation to perform eye analysis through key steps listed below:
imports waveform data via ade2wave
resamples the extracted data by symbol time
constructs an Eye Diagram object (using eyeDiagramSI)
computes metrics (eye height or eye width)
plots either eye diagram or eye contour
saves the waveform data per data point in maestro documents folder
Visualize Simulation Data in Real Time
A headless MATLAB session processes data as the Cadence simulation runs. When the eye diagram has sufficient data, MATLAB opens a figure window showing the eye plot immediately a sample of which is shown below:
View Results in ADE
Computed metrics (e.g., eye width/height) are returned to ADE and appear in the Results table across corners/sweeps in Cadence ADE maestro view as shown below:
Save Waveform Data
When argument saveWaveData is marked true in eyeAnalysis, the function derives the Cadence Maestro project path using ADE RDB location, then writes a MAT file under the corresponding documents folder. The file is uniquely named per data point using the net name and AdeInfoManager data point index. This step takes place as soon as a specific corner data gets available. This is highly useful for a long running simulation where user needs to post process a corner result as soon as the waveform data is available.This enables quicker offline MATLAB analysis, and easy sharing across the team.
Function Definition
The eyeAnalysis function defined below imports waveform data via ade2wave, resamples by symbol time, constructs an Eye Diagram object (eyeDiagramSI), computes metrics, optionally plots, and can save the waveform data per data point. eyeDiagramSI is the key feature that is utilized in this function. Also, one thing to note is that eyeDiagramSI also works on PAM-N waveform data.
function eyeMeasure = eyeAnalysis(netname, NameValueArgs)
% EYEANALYSIS  Compute eye diagram metrics within Cadence ADE via MATLAB.
%
% This function is designed to be called from Cadence ADE as a matlabexpr
% (EvalType = point). It uses Mixed-Signal Blockset capabilities to:
%   1) Import waveform data from ADE via ade2wave().
%   2) Resample the waveform to a uniform (fixed-step) time grid.
%   3) Build an eye-diagram object (eyeDiagramSI).
%   4) Optionally plot the eye and SER contour in real-time.
%   5) Optionally save raw waveform data (x, y) into the Maestro /documents folder.
%   6) Return a selected metric (eyeHeight or eyeWidth) back to ADE.
%
% USAGE (in ADE Outputs Setup):
%   eyeAnalysis('/o2', EyeHeight=true, PlotEye=true, SaveWaveData=true)
%
% IMPORTANT:
% - In ADE Outputs Setup, set the matlabexpr **EvalType = point** so this
%   function evaluates per simulation point/corner and produces per-point
%   metrics, plots, and saved waveform files.
%
% INPUTS:
%   netname       : (char/string) Net name from ADE (e.g., '/o1', '/o2').
%
% NAME-VALUE ARGUMENTS (NameValueArgs):
%   SamplesPerSymbol : (double) Samples used per symbol for resampling. Default: 32
%   SymbolTime       : (double) Symbol time (seconds). Default: 8e-10
%   SymbolThresholds : (double or vector) Decision threshold(s). Default: 0.45
%   EyeHeight        : (logical) If true, return eye height. Default: false
%   EyeWidth         : (logical) If true, return eye width. Default: false
%   PlotEye          : (logical) If true, plot eye diagram figure. Default: false
%   PlotContour      : (logical) If true, add SER contour to the plot. Default: false
%   SaveWaveData     : (logical) Save raw x,y waveform to Maestro /documents. Default: true
%
% OUTPUT:
%   eyeMeasure : (double) The requested eye metric (height or width).
%                If neither eyeHeight nor eyeWidth is requested, returns NaN.
%
% DEPENDENCIES:
%   - Cadence Virtuoso - MATLAB Integration API
%   - Mixed-Signal Blockset ade2wave, eyeDiagramSI, eyeContour
%
% -------------------------------------------------------------------------

% ---------- Argument block and defaults ----------
arguments
    netname                                           % ADE net name (e.g. '/o1')
    NameValueArgs.SamplesPerSymbol (1,1) double = 32  % Resampling resolution per symbol
    NameValueArgs.SymbolTime (1,1) double = 8e-10     % Symbol duration in seconds
    NameValueArgs.SymbolThresholds = 0.45             % Threshold(s) for decision levels
    NameValueArgs.EyeHeight (1,1) logical = false     % Return eye height if true
    NameValueArgs.EyeWidth (1,1) logical = false      % Return eye width if true
    NameValueArgs.PlotEye (1,1) logical = false       % Plot eye figure if true
    NameValueArgs.PlotContour (1,1) logical = false   % Plot SER contour if true
    NameValueArgs.SaveWaveData (1,1) logical = true   % Save raw (x,y) to Maestro
end

% ---------- Basic sanity checks ----------
if isempty(netname) || ~ischar(netname) && ~isstring(netname)
    error("Input ""netname"" must be a non-empty char/string (e.g., ''/o1'').");
end
if NameValueArgs.SamplesPerSymbol <= 0
    error("SamplesPerSymbol must be > 0.");
end
if NameValueArgs.SymbolTime <= 0
    error("SymbolTime must be > 0 (seconds).");
end

% ---------- Acquire waveform from ADE ----------
% ade2wave() returns:
%   x : time vector (seconds)
%   y : waveform samples (volts or relevant units)
try
    [x, y] = ade2wave(char(netname));
catch ME
    error("ade2wave failed for net ""%s"": %s", char(netname), ME.message);
end

if isempty(x) || isempty(y)
    error("Received empty waveform data from ADE for net ""%s"".", char(netname));
end

% ---------- Resample to fixed-step grid ----------
% Fixed-step sample interval derived from user inputs:
%   sampleInterval = SymbolTime / SamplesPerSymbol
% This improves eye diagram construction and metric accuracy.
sampleInterval = NameValueArgs.SymbolTime / NameValueArgs.SamplesPerSymbol;

% Use MATLAB resample to build a uniformly sampled waveform v(t)
% Note: resample(y, x, Fs) expects y as signal and x as time, Fs = 1/sampleInterval
v = resample(y, x, 1 / sampleInterval);

% ---------- Create eye diagram object ----------
% eyeDiagramSI is suitable for sample-interval-based eye analysis.
ed = eyeDiagramSI;
ed.SampleInterval    = sampleInterval;                 % Fixed sample step
ed.SymbolTime        = NameValueArgs.SymbolTime;       % Symbol duration
ed.SymbolThresholds  = NameValueArgs.SymbolThresholds; % Decision threshold(s)

% Feed the uniformly sampled data into the eye diagram
ed(v);

% ---------- Compute requested metric(s) ----------
% Only one metric is returned. If both are requested, eyeWidth takes precedence.
eyeMeasure = NaN;  % Default return value when no metric is requested

if NameValueArgs.EyeHeight
    eyeMeasure = ed.eyeHeight;
end
if NameValueArgs.EyeWidth
    eyeMeasure = ed.eyeWidth;  % Preferred metric when both flags are true
end

% ---------- Optional plotting ----------
% If plotEye=true, a MATLAB figure window will open (even during ADE runs)
% as soon as enough data is available, showing the eye diagram.
if NameValueArgs.PlotEye
    plot(ed);        % Eye diagram density plot
    grid on;
    hold on;
end

% If plotContour=true, overlay SER (Symbol Error Rate) contour
if NameValueArgs.PlotContour
    ct = eyeContour(ed, "SER", 1e-3);   % SER target = 1e-3 (example)
    plot(ct);
    grid on;
    hold on;
end

% ---------- Optional saving of raw waveform data ----------
% If saveWaveData=true, store (x, y) in Maestro /documents per data point.
% This provides traceability and enables offline post-processing.
if NameValueArgs.SaveWaveData
    % Obtain the ADE database (RDB) location path. It typically ends with .../results
    adeRDB = cadence.AdeInfoManager.getInstance.adeRDBLocation;

    % Split the RDB path to strip the trailing '/results'
    splitStr = strsplit(adeRDB, "/results");

    % Get the current data point index from AdeInfoManager
    dataPoint = cadence.AdeInfoManager.getInstance.adeDataPoint;

    % Compose a unique file name using netname and data point
    wName = [char(netname), 'DataPoint:', num2str(dataPoint)];

    % Build the destination file path in Maestro /documents folder
    filePath = fullfile(splitStr{1}, "documents", [wName, '.mat']);

    % Persist time and waveform arrays
    try
        save(filePath, "x", "y");
    catch ME
        warning("Failed to save waveform to ""%s"": %s", filePath, ME.message);
    end
end

% ---------- warning message if no metric was requested ----------
if isnan(eyeMeasure)
    % Neither eyeHeight nor eyeWidth was requested; inform the user.
    % Returning NaN prevents misleading results in ADE.
    warning(["No metric selected. Set EyeHeight=true or ", ...
        "EyeWidth=true to return a numeric value."]);
end
end