Main Content

lookangles

Satellite look angles from receiver and satellite positions

Description

[az,el,vis] = lookangles(recPos,satPos) returns the look angles and visibilities of satellite positions for a given receiver position. The azimuth az and elevation el are the look angles in degrees in the Earth-centered Earth-fixed (ECEF) coordinate system. The visibility of the satellites vis is a logical array that the function calculates using the default receiver mask angle of 10 degrees.

[___,vis] = lookangles(recPos,satPos,maskAngle) uses a uniform elevation mask defined by an elevation angle to determine which satellites are visible.

example

[___,vis] = lookangles(___,maskAngle,maskAzimuthEdges) uses an elevation mask, defined by specified elevation mask angles and mask azimuth edges, to determine which satellites are visible.

example

Examples

collapse all

Use the lookangles function to get the azimuth and elevation angles of satellites for given satellite and receiver positions. Specify a mask angle of 5 degrees. Get the satellite positions using the gnssconstellation function.

Specify a receiver position in geodetic coordinates (latitude, longitude, altitude).

recPos = [42 -71 50];

Get the satellite positions for the current time.

t = datetime('now');
gpsSatPos = gnssconstellation(t);

Specify a mask angle of 5 degrees.

maskAngle = 5;

Get the azimuth and elevation look angles for the satellite positions. The vis output indicates which satellites are visible. Get the total using nnz.

[az,el,vis] = lookangles(recPos,gpsSatPos,maskAngle);
fprintf('%d satellites visible at %s.\n',nnz(vis),t);
8 satellites visible at 24-Jan-2026 22:52:35.

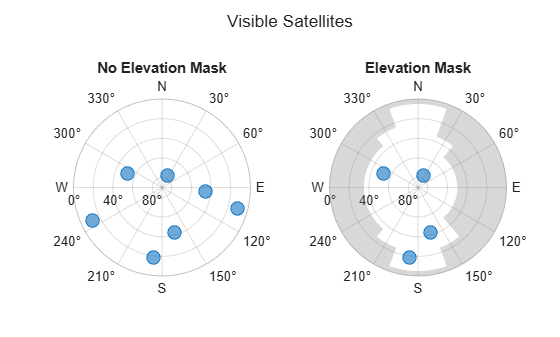
Specify a custom elevation mask to model the effect of nearby buildings on satellite visibility. In this scenario, the receiver is positioned on a city road, with higher obstructions to the east and west.

recPos = [42 -71 50];
maskAngles = [5 35 50 25 5 25 35 25 5];
azEdges = [0 20 40 140 160 200 220 320 340 360];

Set the observation time and obtain satellite positions for that instant.

t = datetime(2025,10,1);
satPos = gnssconstellation(t);

Determine which satellites are visible, first without any mask, then apply the elevation mask to represent the urban obstructions.

[az,el,visMask] = lookangles(recPos,satPos,maskAngles,azEdges);
[az,el,visNoMask] = lookangles(recPos,satPos);

Visualize the results by comparing satellite visibility with and without the elevation mask.

t1 = tiledlayout(1,2);
title(t1,"Visible Satellites");

nexttile
skyplot(az(visNoMask),el(visNoMask))
title("No Elevation Mask")

nexttile
skyplot(az(visMask),el(visMask),MaskElevation=maskAngles,MaskAzimuthEdges=azEdges)
title("Elevation Mask")

Figure contains objects of type skyplot.

Input Arguments

collapse all

Receiver position in geodetic coordinates, specified as a three-element vector of the form [latitude longitude altitude]

Data Types: single | double

Satellite positions in the Earth-centered Earth-fixed (ECEF) coordinate system in meters, specified as an N-by-3 matrix of scalars. N is the number of satellites in the constellation.

Data Types: single | double

Elevation mask angles, specified as either a numeric scalar or n-element vector of values in the range [0, 90]. Units are in degrees.

The shape of the elevation mask depends on the size of maskAngle:

  • If maskAngle is a numeric scalar, then the elevation mask applies to the entire azimuth plane.

  • If maskAngle is an n-element vector, each specified elevation mask angle in maskAngle applies to a corresponding azimuth interval defined by maskAzimuthEdges.

Example: lookangles(__,maskAngle=25) uses a mask elevation angle of 25 degrees for the entire azimuth plane.

Example: lookangles(__,maskAngle=[15 30 15 10]) uses mask elevation angles of 15, 30, 15, and 10 degrees for the azimuth angle intervals [0, 90), [90, 180), [180, 270), and [270, 360), respectively.

Example: lookangles(__,maskAngle=[15 30 15 10],maskAzimuthEdges=[0 180 210 280 360]) uses mask elevation angles of 15, 30, 15, and 10 degrees for the azimuth angle intervals [0, 180), [180, 210), [210, 280), and [280, 360), respectively.

Data Types: single | double

Azimuth edges of the elevation mask, specified as an m-element row vector, where m is the total number of azimuth edges.

Each azimuth interval defined by the specified azimuth edges corresponds to a specified mask angle in maskAngle.

By default, lookangles uses azimuth edges that divide the 360 degree azimuth plane into n equal angle intervals that correspond to each of the n elevation mask angles in maskAngle.

Example: lookangles(__,maskAngle=[15 30 15 10]) uses mask elevation angles of 15, 30, 15, and 10 degrees for the azimuth angle intervals [0, 90), [90, 180), [180, 270), and [270, 360), respectively.

Example: lookangles(__,maskAngle=[15 30 15 10],maskAzimuthEdges=[0 180 210 280 360]) uses mask elevation angles of 15, 30, 15, and 10 degrees for the azimuth angle intervals [0, 180), [180, 210), [210, 280), and [280, 360), respectively.

Data Types: double

Output Arguments

collapse all

Azimuth angles for visible satellite positions, returned as an n-element vector of angles. n is the number of visible satellite positions in the plot. Azimuth angles are measured in degrees, clockwise-positive from the north direction looking down.

Example: [25 45 182 356]

Data Types: double

Elevation angles for visible satellite positions, returned as an n-element vector of angles. n is the number of visible satellite positions in the plot. Elevation angles are measured from the horizon line with 90 degrees being directly up.

Example: [45 90 27 74]

Data Types: double

Satellite visibility, returned as an n-element logical array. Each element indicates whether the satellite position given by az and el is visible.

Data Types: logical

Extended Capabilities

expand all

C/C++ Code Generation
Generate C and C++ code using MATLAB® Coder™.

Version History

Introduced in R2021a

expand all