Run Analysis and Review Results in Eclipse
After you configure the Polyspace®
as You Code™ plugin, you are ready to run an analysis and fix or justify any results. Before continuing this guide, confirm you have added the files example.hpp and example_source.cpp to the Quality Monitoring list.
Run Polyspace as You Code Analysis in Eclipse
You can run an analysis in these ways:
If you select Start analysis on save, save your edited file to run an analysis.
Right-click in the file editor with your file open and select Run Polyspace Analysis.
Manually add your file to the Quality Monitoring list and click the Run Polyspace Analysis button
 in the Quality Monitoring pane to analyze your file.
Polyspace analyzes only files that are part of the Eclipse™ workspace. To add a file to a workspace, you add it to a project in that workspace. Files that are not in the workspace are not analyzed even if you add them to the Quality Monitoring list. If a file that you analyze includes a file that is not in the workspace, the Polyspace as You Code analysis runs but does not report any results in the included file.

View, Fix, or Justify Findings
After Polyspace runs the analysis, the filename in the Quality Monitoring pane is green if there are no results and red if there are results. A number to the right of the filename indicates the number of results.
View a list of your results in the Polyspace Problems pane, which opens by default when you open the Polyspace as You Code perspective in Eclipse. If the Polyspace Problems pane is not open, reset the perspective by clicking Window > Perspective > Reset Perspective.
Use the filter in the Polyspace Problems pane to search for specific results. Each result contains a filename and line number to indicate where the result exists in your code.
After you run an analysis on the example code:
Open the results in the Polyspace Problems pane.
Click the filter icon
 and create a new filter to search for the text
 A16-2-3. There is one result on line five.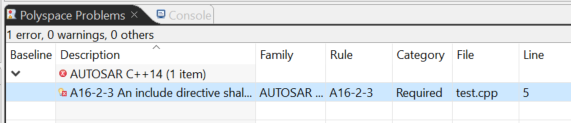
Click the result in the Polyspace Problems pane to open the file that contains the result.
Each result is noted in the file with a red highlight. Click the highlighted sections of code to see a list of each result associated with the problem in the Result Details pane.
In the example code, add this
#includestatement on line two:#include <cstdint>
Save this change and run another analysis. The
A16-2-3error on line five is no longer present.
If you set up automatic analysis, you can find and fix results during the code authoring process. Each time you save changes, a Polyspace analysis begins in the background and displays any new results or removes fixed results from the list.
Justify Individual Findings
You can justify a result from the Polyspace Problems pane or from the location of the result in the code.
Right-click a result in the Polyspace Problems pane and select Polyspace. Select the appropriate justification from the menu. This adds a comment to your code, which you can amend. Adding a justification removes the result from the Polyspace Problems pane. To show the result again, remove the justification comment and perform an analysis.
Provide Justification Catalog
You can add a catalog of predefined justifications to Polyspace as You Code. The justification catalog allows you to select a prewritten justification instead of manually entering each justification comment. The catalog must be in JSON format. If you do not already have a justification catalog, use this example JSON file.
example_catalog.json
{
	"justifications": [
		{
		"family": "Defect",
		"acronym": "INT_ZERO_DIV",
		"comment": "This is my justification for division"
		},
		{
		"family": "Defect",
		"acronym": "INT_ZERO_DIV",
		"comment": "Alternative justification for division"
		}
	]
}
Open the Eclipse Preferences and select Polyspace as You Code. Next to the Justification catalog text box, click Browse and navigate to your justification catalog.
View Header Findings
When you analyze source files, you see any header file results in the Polyspace Problems pane. If a header contains any results, the results are noted with a red H next to the source file in the Quality Monitoring list.
Double-click a header result in the Polyspace Problems pane to go to the header file that contains the result. The source file analysis that caused the header result is listed in the Header column of the Polyspace Problems pane.