phased.URA.plotGratingLobeDiagram
Plot grating lobe diagram of array
Syntax
Description
plotGratingLobeDiagram(
plots the grating lobe diagram of an array in the u-v coordinate
system. The System object™
array,freq)array specifies the array. The argument
freq specifies the signal frequency. The array, by default,
is steered to 0° azimuth and 0° elevation.
A grating lobe diagram displays the positions of the peaks of the narrowband array pattern. The array pattern depends only upon the geometry of the array and not upon the types of elements which make up the array. Visible and non-visible grating lobes are displayed as open circles. Only grating lobe peaks near the location of the mainlobe are shown. The mainlobe itself is displayed as a filled circle.
hndl = plotGratingLobeDiagram(___)hndl to the plot for any of the input
syntaxes.
Examples
Plot the grating lobe diagram for an 11-by-9-element uniform rectangular array having element spacing equal to one-half wavelength.
Assume the operating frequency of the array is 10 kHz. All elements are omnidirectional microphone elements. Steer the array in the direction 20° in azimuth and 30° in elevation. The speed of sound in air is 344.21 m/s at 21° C.
cair = 344.21;
f = 10.0e3;
lambda = cair/f;
microphone = phased.OmnidirectionalMicrophoneElement(...
    FrequencyRange=[20 20000]);
array = phased.URA(Element=microphone,Size=[11,9], ...
    ElementSpacing=0.5*lambda*[1,1]);
plotGratingLobeDiagram(array,f,[20;30],cair);
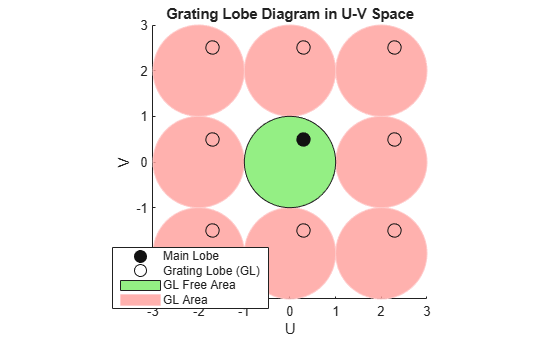
Plot the grating lobes. The main lobe of the array is indicated by a filled black circle. The grating lobes in visible and nonvisible regions are indicated by unfilled black circles. The visible region is the region in u-v coordinates for which . The visible region is shown as a unit circle centered at the origin. Because the array spacing is less than one-half wavelength, there are no grating lobes in the visible region of space. There are an infinite number of grating lobes in the nonvisible regions, but only those in the range [-3,3] are shown.
The grating-lobe free region, shown in green, is the range of directions of the main lobe for which there are no grating lobes in the visible region. In this case, it coincides with the visible region.
The white areas of the diagram indicate a region where no grating lobes are possible.
Plot the grating lobe diagram for an 11-by-9-element uniform rectangular array having element spacing greater than one-half wavelength. Grating lobes are plotted in u-v coordinates.
Assume the operating frequency of the array is 10 kHz and the spacing between elements is 0.75 of a wavelength. All elements are omnidirectional microphone elements. Steer the array in the direction 20° in azimuth and 30° in elevation. The speed of sound in air is 344.21 m/s at 21° C.
cair = 344.21;
f = 10000;
lambda = cair/f;
sMic = phased.OmnidirectionalMicrophoneElement(...
    FrequencyRange=[20 20000]);
sURA = phased.URA(Element=sMic,Size=[11,9], ...
    ElementSpacing=0.75*lambda*[1,1]);
plotGratingLobeDiagram(sURA,f,[20;30],cair);
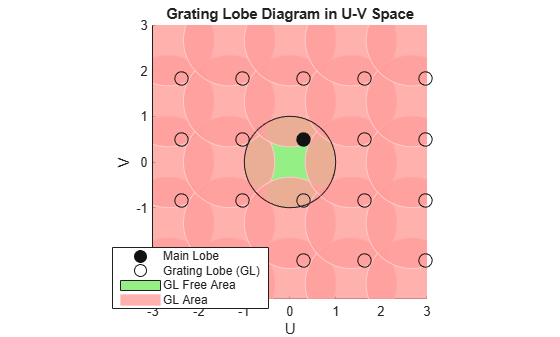
The main lobe of the array is indicated by a filled black circle. The grating lobes in visible and nonvisible regions are indicated by unfilled black circles. The visible region is the region in u-v coordinates for which . The visible region is shown as a unit circle centered at the origin. Because the array spacing is greater than one-half wavelength, there are grating lobes in the visible region of space. There are an infinite number of grating lobes in the nonvisible regions, but only those in the range [-3,3] are shown.
The grating-lobe free region, shown in green, is the range of directions of the main lobe for which there are no grating lobes in the visible region. In this case, it lies inside the visible region. Because the mainlobe is outside the green area, there is a grating lobe within the visible region.
Plot the grating lobe diagram for an 11-by-9-element uniform rectangular array having element spacing greater than one-half wavelength. Apply a 20% phase-shifter frequency offset. Grating lobes are plotted in u-v coordinates.
Assume the operating frequency of the array is 10 kHz and the spacing between elements is 0.75 of a wavelength. All elements are omnidirectional microphone elements. Steer the array in the direction 20° in azimuth and 30° in elevation. The shifted frequency is 12000 Hz. The speed of sound in air is 344.21 m/s at 21° C.
cair = 344.21;
f = 10000;
f0 = 12000;
lambda = cair/f;
sMic = phased.OmnidirectionalMicrophoneElement(...
    FrequencyRange=[20 20000]);
sURA = phased.URA(Element=sMic,Size=[11,9], ...
    ElementSpacing=0.75*lambda*[1,1]);
plotGratingLobeDiagram(sURA,f,[20;30],cair,f0);
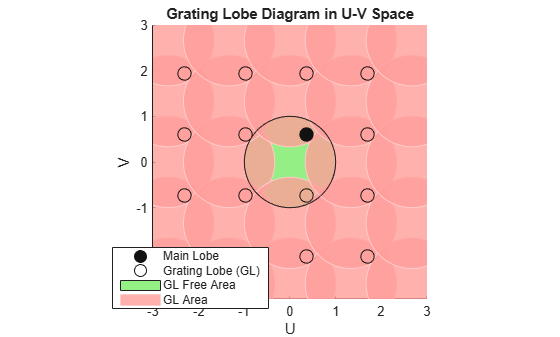
The mainlobe of the array is indicated by a filled black circle. The mainlobe has moved from its position in the previous example due to the frequency shift. The grating lobes in visible and nonvisible regions are indicated by unfilled black circles. The visible region is the region in u-v coordinates for which . The visible region is shown as a unit circle centered at the origin. Because the array spacing is greater than one-half wavelength, there are grating lobes in the visible region of space. There are an infinite number of grating lobes in the nonvisible regions, but only those in the range [-3,3] are shown.
The grating-lobe free region, shown in green, is the range of directions of the main lobe for which there are no grating lobes in the visible region. In this case, it lies inside the visible region. Because the mainlobe is outside the green area, there is a grating lobe within the visible region.
Input Arguments
Algorithms
References
[1] Van Trees, H.L. Optimum Array Processing. New York: Wiley-Interscience, 2002.
Version History
Introduced in R2011a