smithplot
Plot impedance transformation for selected matching network on Smith Chart
Description
smithplot( plots the impedance
transformation from the source to load for the best matching network on a
Smith® Chart.mnobj)
smithplot(___,
plots the impedance transformation from the source to load on a Smith Chart with additional properties given by Name, Value pair. For instance
Name,Value)smithplot (MNOBJ, 'CircuitIndex',____, 'Z0', _____) plots the
impedance transformation for the selected matching network circuit at the
characteristic impedance, Z0 on a Smith Chart.
Properties not specified retain their default values.
Note
For more name value pairs see, Tips.
Examples
Create a new matchingnetwork and plot the impedance transformation of the second matching network circuit in the design.
f       = 2e9;          % Center frequency, Hz
Zin     = 150+75i;      % Source impedance, Ohms
Zl      = 75+15i;       % Load impedance, Ohms
Zo      = 75;           % characteristic impedance of system, Ohms
Design matching network object.
n = matchingnetwork(CenterFrequency=f,Bandwidth=1e8,           ...
  LoadImpedance=Zl,SourceImpedance=Zin,Components=2);
View Circuit #2.
n.Circuit(2)
ans =
  circuit: Circuit element

    ElementNames: {'C'  'L'}
        Elements: [1×2 rf.internal.circuit.RLC]
           Nodes: [1 2 3]
            Name: 'auto_1'
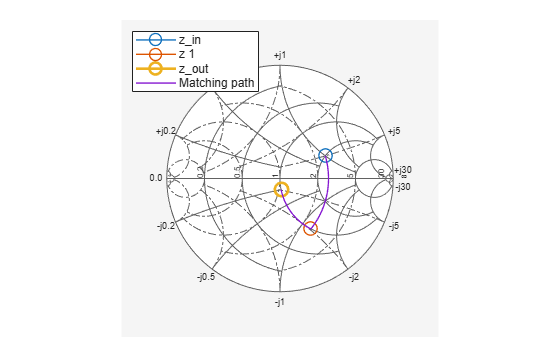
Impedance transformation of Circuit #2 on a Smith chart.
hs = smithplot(n, Z0=Zo, CircuitIndex=2);
Input Arguments
Name-Value Arguments
Tips
To list other property
Name,Valuepairs insmithplot, usedetails(s)wheresis asmithplotobject. You can use the properties to extract any data from the Smith Chart.For a list of properties of
smithplot, see SmithPlot Properties.You can use the
smithplotinteractive menu to change the line and marker styles.
Version History
Introduced in R2019a
See Also
add | replace | matchingnetwork | rfplot | sparameters