uplot
Plot multiple frequency response objects and doubles on same graph
Syntax
uplot(G1)
uplot(G1,G2)
uplot(G1,Xdata,Ydata)
uplot(G1,Xdata,Ydata,...)
uplot(G1,linetype)
uplot(G1,linetype,G2,...)
uplot(G1,linetype,Xdata,Ydata,linetype)
uplot(type,G1,linetype,Xdata,Ydata,linetype)
H = uplot(G1)
H = uplot(G1,G2)
H = uplot(G1,Xdata,Ydata)
H = uplot(G1,Xdata,Ydata,...)
H = uplot(G1,linetype)
H = uplot(G1,linetype,G2,...)
H = uplot(G1,linetype,Xdata,Ydata,linetype)
Description
uplot plots double and frd objects. The syntax is the same as the MATLAB® plot command except that all data is contained in frd objects, and the axes are specified by type.
The (optional) type argument must be one of
Type | Description |
|---|---|
'iv,d' | Data versus independent variable (default) |
'iv,m' | Magnitude versus independent variable |
'iv,lm' |
|
'iv,p' | Phase versus independent variable |
'liv,m' | Magnitude versus |
'liv,d' | Data versus |
'liv,m' | Magnitude versus |
'liv,lm' |
|
'liv,p' | Phase versus |
'r,i' | Real versus imaginary (parametrize by independent variable) |
'nyq' | Real versus imaginary (parametrize by independent variable) |
'nic' | Nicholas plot |
'bode' | Bode magnitude and phase plot |
The remaining arguments of uplot take the same form as the MATLAB plot command. Line types (for example,'+', 'g-.', or '*r') can be optionally specified after any frequency response argument.
There is a subtle distinction between constants and frd objects with only one independent variable. A constant is treated as such across all frequencies, and consequently shows up as a line on any graph with the independent variable as an axis. A frd object with only one frequency point always shows up as a point. You might need to specify one of the more obvious point types in order to see it (e.g., '+', 'x', etc.).
Examples
Create two SISO second-order systems, and calculate their frequency responses over different frequency ranges.
a1 = [-1,1;-1,-0.5];
b1 = [0;2]; c1 = [1,0]; d1 = 0;
sys1 = ss(a1,b1,c1,d1);
a2 = [-.1,1;-1,-0.05];
b2 = [1;1]; c2 = [-0.5,0]; d2 = 0.1;
sys2 = ss(a2,b2,c2,d2);
omega = logspace(-2,2,100);
sys1g = frd(sys1,omega);
omega2 = [ [0.05:0.1:1.5] [1.6:.5:20] [0.9:0.01:1.1] ];
omega2 = sort(omega2);
sys2g = frd(sys2,omega2);
Create an frd object with a single frequency.
sys3 = rss(1,1,1);
rspot = frd(sys3,2);
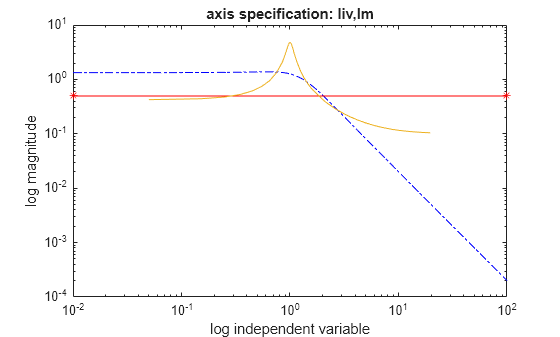
The following plot uses the plot_type specification 'liv,lm'.
uplot('liv,lm',sys1g,'b-.',rspot,'r*-',sys2g);
xlabel('log independent variable')
ylabel('log magnitude')
title('axis specification: liv,lm')
Version History
Introduced before R2006a