Main Content

mlreportgen.report.Sparkline Class

Namespace: mlreportgen.report
Superclasses: mlreportgen.report.Reporter

Sparkline reporter

Since R2026a

Description

Use the mlreportgen.report.Sparkline to create a sparkline reporter.

The mlreportgen.report.Sparkline class is a handle class.

Class Attributes

HandleCompatible
true

For information on class attributes, see Class Attributes.

Creation

Description

reporter = mlreportgen.report.Sparkline creates an empty Sparkline reporter object. Use the reporter properties to specify the sparkline data, the appearance of the sparkline, the information to include about the sparkline, and the report options. Adding an empty Sparkline reporter to a report produces an error.

reporter = mlreportgen.report.Sparkline(data) creates a Sparkline reporter and sets the Data property set to data.

example

reporter = mlreportgen.report.Sparkline(PropertyName=Value) sets the reporter properties using name-value arguments. You can specify multiple name-value arguments in any order.

Input Arguments

expand all

Data to use to generate the sparkline, specified as an array of doubles. This argument sets the Data property.

Properties

expand all

Data to use to generate the sparkline, specified as an array of doubles.

Attributes:

GetAccess
public
SetAccess
public

Data Types: double

Snapshot reporter, specified as an mlreportgen.report.FormalImage object. Use the properties of the FormalImage object to specify the caption for the snapshot image or to customize the size of the image.

Note

The reporter initializes the Snapshot property. Do not clear or modify this property.

Attributes:

GetAccess
public
SetAccess
public

Snapshot image format, specified as one of these formats:

ValueImage FormatSupported in HTMLSupported in WordSupported in PDF

Supported in PDF/A (since R2025a)

"jpg"JPEG imageYesYesYesNo
"png"Portable Network Graphics YesYesYesYes
"svg"Scalable Vector GraphicsYesYesYesYes

Attributes:

GetAccess
public
SetAccess
public

Data Types: char | string

Type of sparkline to draw, specified as one of these values:

Sparkline StyleDescription
"dashed"Dashed line
"dotted"Dotted line
"solid"Single line

Attributes:

GetAccess
public
SetAccess
public

Line color, specified as a character vector or string scalar that contains a CSS color name, hexadecimal RGB value, or decimal RGB value.

FormatValue
CSS color nameSpecify a CSS color name. For a list of CSS color names, see https://www.w3.org/wiki/CSS/Properties/color/keywords.
Hexadecimal RGB valueUse the format "#RRGGBB". Use # as the first character and two-digit hexadecimal numbers for the red, green, and blue values. You can use uppercase or lowercase letters.
Decimal RGB color valueUse the format "rgb(r,g,b)", where r, g, and b are comma-separated positive integers that specify the red, green, and blue values, respectively. Each value range must be between 0 and 255.

Example: "red" specifies a red color using a CSS color name.

Example: "#0000ff" specifies a blue color using a hexadecimal RGB value.

Example: "rgb(128,0,128)" specifies a purple color using a decimal RGB color value.

Attributes:

GetAccess
public
SetAccess
public

Data Types: char | string

Width of the sparkline, specified as a character vector or string scalar that contains a number followed by an abbreviation for a unit of measurement. For example, "0.75pt" specifies 0.75 points. Valid abbreviations are:

  • "px" — Pixels

  • "cm" — Centimeters

  • "in" — Inches

  • "mm" — Millimeters

  • "pc" — Picas

  • "pt" — Points

Example: "0.75pt"

Attributes:

GetAccess
public
SetAccess
public

Data Types: char | string

Data points on the sparkline at which to display markers, specified as a character vector, string scalar, a cell array of character vectors, or an array of string scalars of these values:

Marker PointsDescription
[]No markers
"all"Display markers at all data points
"min"Display markers at the minimum points
"max"Display markers at the maximum points
"first"Display marker at the first data point
"last"Display marker at the last data point
"negative"Display markers at the negative data points

Example: "all"

Example: {'first' 'last'}

Example: ["max" "first" "last"]

Attributes:

GetAccess
public
SetAccess
public

Data Types: char | string

Style of marker, specified as one of these values:

Marker PointsDescription
"square"Displays markers as squares
"circle"Display markers as circles

Attributes:

GetAccess
public
SetAccess
public

Data Types: char | string

Default color of the markers, specified as a character vector or string scalar that contains a CSS color name, hexadecimal RGB value, or decimal RGB value.

FormatValue
CSS color nameSpecify a CSS color name. For a list of CSS color names, see https://www.w3.org/wiki/CSS/Properties/color/keywords.
Hexadecimal RGB valueUse the format "#RRGGBB". Use # as the first character and two-digit hexadecimal numbers for the red, green, and blue values. You can use uppercase or lowercase letters.
Decimal RGB color valueUse the format "rgb(r,g,b)", where r, g, and b are comma-separated positive integers that specify the red, green, and blue values, respectively. Each value range must be between 0 and 255.

Example: "red" specifies a red color using a CSS color name.

Example: "#0000ff" specifies a blue color using a hexadecimal RGB value.

Example: "rgb(128,0,128)" specifies a purple color using a decimal RGB color value.

Attributes:

GetAccess
public
SetAccess
public

Data Types: char | string

Size of the markers, specified as a character vector or string scalar that contains a number followed by an abbreviation for a unit of measurement. For example, "0.75pt" specifies 0.75 points. Valid abbreviations are:

  • "px" — Pixels

  • "cm" — Centimeters

  • "in" — Inches

  • "mm" — Millimeters

  • "pc" — Picas

  • "pt" — Points

You can also specify pixels by omitting the unit. For example, "5" specifies 5 pixels.

Attributes:

GetAccess
public
SetAccess
public

Data Types: char | string

Source of the template for this reporter, specified in one of these ways:

  • Character vector or string scalar that specifies the path of the file that contains the template for this reporter

  • Reporter or report whose template this reporter uses or whose template library contains the template for this reporter

  • Document Object Model (DOM) document or document part whose template this reporter uses or whose template library contains the template for this reporter

The specified template must be the same type as the report to which you append this reporter. For example, for a Microsoft® Word report, TemplateSrc must be a Word reporter template. If the TemplateSrc property is empty, this reporter uses the default reporter template for the output type of the report.

Attributes:

GetAccess
public
SetAccess
public
NonCopyable
true
Dependent
true

Name of the template for this reporter, specified as a character vector or string scalar. The template for this reporter must be in the template library of the template specified by the TemplateSrc property of this reporter.

Attributes:

GetAccess
public
SetAccess
public

Data Types: char | string

Hyperlink target for this reporter, specified as a character vector or string scalar that specifies the link target ID, or an mlreportgen.dom.LinkTarget object. A character vector or string scalar value converts to a LinkTarget object. The link target immediately precedes the content of this reporter in the output report.

Attributes:

GetAccess
public
SetAccess
public

Methods

expand all

Examples

collapse all

This example shows how to add sparklines to a report table.

Import the Report and DOM API namespaces so that you do not have to use long, fully qualified names.

import mlreportgen.report.*
import mlreportgen.dom.*

Create a table that contains the sales data from January to June for four companies from the list of company names, the sales data, and the names of the months. The rows of the sales data matrix correspond to the companies and the columns correspond to the months.

companyNames = ["Apple", "Amazon", "Microsoft", "Google"];

salesData = [
    38, 56, 50, 2, 45, 65;   % Data for Apple
    43, 78, 53, 72, 48, 75;  % Data for Amazon
    50, 60, 55, 65, 52, 70;  % Data for Microsoft
    55, 70, 60, 75, 57, 80]; % Data for Google

months = ["Jan", "Feb", "Mar", "Apr", "May", "Jun"];

The "companyNames" array is the first column, followed by columns for each month of sales data. The final column, "Trends", is empty. In this example, you will populate this column with the sparkline for each company.

tbl = table(companyNames', ...
    salesData(:, 1), salesData(:, 2), salesData(:, 3), ...
    salesData(:, 4), salesData(:, 5), salesData(:, 6), ...
    char.empty(4, 0), ...
'VariableNames', ['CompanyName', months, "Trends"]);

Create a new report titled "StockMarketReport" and specify the output format as PDF.

rpt = Report("StockMarketReport","pdf");

Create a MATLABTable reporter object from the table, tbl.

mlTable = MATLABTable(tbl);

Loop through each row in the table and perform the following operations to add sparklines from the sales data of each company.

  • Create a new table entry for the current row.

  • Create a sparkline for the sales data of the current company.

  • Get a snapshot image of the sparkline to include in the report.

  • Create a DOM image object using the captured snapshot image.

  • Append the DOM image to the table entry (this adds the sparkline to the cell).

  • Add the table entry to the corresponding row in the MATLAB table.

for iRow = 1:mlTable.Body.NRows
    tEntry = TableEntry();
    sparkline = Sparkline(salesData(iRow, :));
    image = getSnapshotImage(sparkline, rpt);
    domImage = Image(image);
    append(tEntry, domImage);
    append(mlTable.Body.row(iRow),tEntry);
end

Append the table with sparklines to the report.

append(rpt,mlTable);

Close and view the report.

close(rpt);
rptview(rpt);

This example shows how to add a customized sparkline with a caption to a report.

Import the Report and DOM API namespaces so that you do not have to use long, fully qualified names.

import mlreportgen.dom.*
import mlreportgen.report.*

Create a report.

rpt = Report("MonthlyTrends", "pdf");

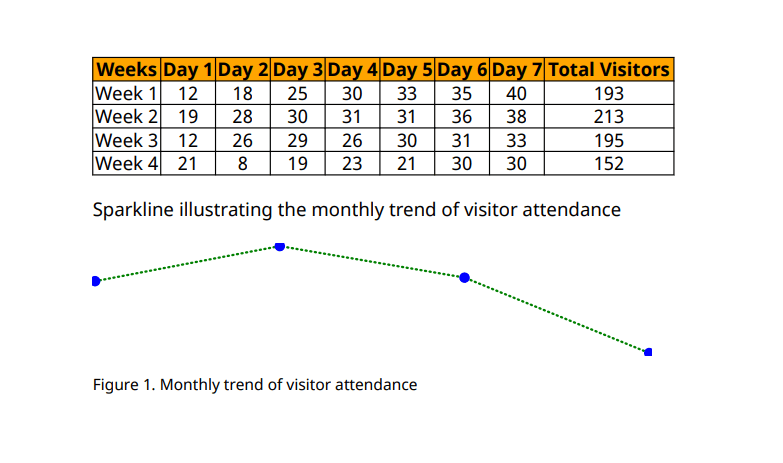
Create a table containing daily visitor data over four weeks and the total number of visitors for each week.

headerContent = {...
    'Weeks', 'Day 1', 'Day 2', 'Day 3', 'Day 4', ...
    'Day 5', 'Day 6', 'Day 7', 'Total Visitors'...
    };

totalVisitors = [193, 213, 195, 152];

bodyContent = {...
    'Week 1', 12, 18, 25, 30, 33, 35, 40, totalVisitors(1); ...
    'Week 2', 19, 28, 30, 31, 31, 36, 38, totalVisitors(2); ...
    'Week 3', 12, 26, 29, 26, 30, 31, 33, totalVisitors(3);
    'Week 4', 21, 8, 19, 23, 21, 30, 30, totalVisitors(4)...
    };

Specify the table formatting.

tableStyle = {Width("80%"), ...
    Border("solid"), ...
    RowSep("solid"), ...
    ColSep("solid")};

Create the formal table with the specified content and formatting.

tbl = FormalTable(headerContent, bodyContent);
tbl.Style = tableStyle;

Specify the header row formatting.

headerStyle = {BackgroundColor("Orange"), ...
    Bold(true)};
firstRow = tbl.Children(1);
firstRow.Style = headerStyle;

Set the table entries alignment to the center.

tbl.TableEntriesHAlign = "center";

Append the table to the report.

append(rpt,tbl);

Add a paragraph explaining the sparkline.

append(rpt, LineBreak());
append(rpt,Paragraph(...
    "Sparkline illustrating the monthly trend of visitor attendance"));
append(rpt, LineBreak());

Create, customize, and append the sparkline to the report.

sparkline = Sparkline(totalVisitors);

sparkline.LineColor = "green";
sparkline.LineStyle = "dotted";
sparkline.LineWidth = "1.5pt";

sparkline.MarkerColor = "blue";
sparkline.MarkerStyle = "circle";
sparkline.MarkerPoints = "all";
sparkline.MarkerSize = "3pt";

sparkline.Snapshot.Height = "1in";
sparkline.Snapshot.Width = "5in";

sparkline.Snapshot.Caption = "Monthly trend of visitor attendance";

append(rpt,sparkline);

Close and view the report.

close(rpt);
rptview(rpt);

A table showing the number of visitors over four weeks, with daily counts from Day 1 to Day 7 and total visitors for each week. Below the table, a sparkline graph depicts the monthly trend of visitor attendance. The sparkline is a green dotted line with blue circulars markers.

Version History

Introduced in R2026a