getTFMap
R2026bDescription
Examples
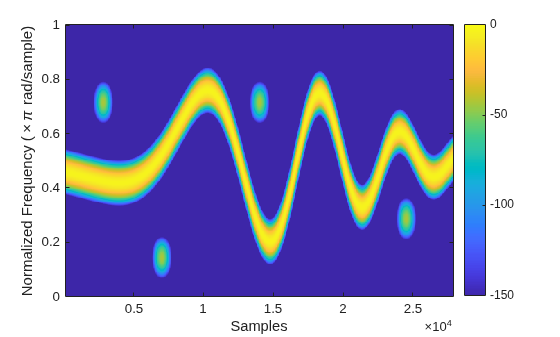
Generate a signal that consists of a voltage-controlled oscillator and four Gaussian atoms. The signal is sampled at 14 kHz for 2 seconds. Plot the spectrogram of the signal.
Fs = 14000;
t = (0:1/Fs:2)';
gaussFun = @(A,x,mu,f) exp(-(x-mu).^2/(2*0.01^2)).*sin(2*pi*f.*x)*A';
atoms = gaussFun([1 1 1 1]/10,t,[0.2 0.5 1 1.75],1e3*[2 6 2 5]);
vcoIn = vco(chirp(t+.1,0,t(end),3).*exp(-2*(t-1).^2),[0.1 0.4]*Fs,Fs);
vcoOut = vcoIn + 0.1*atoms;
Create a set of spectrogram options for time-frequency labeling. Control the spectrogram resolution by leakage. Specify a leakage and an overlap of 99%.
beta = 0.2;
opts = labelSpectrogramOptions("leakage", ...
    Leakage=40*(1-beta),Overlap=99);
Get the STFT map to be used in time-frequency labeling.
[s,w,n] = getTFMap(opts,vcoOut);
Plot the STFT along normalized frequencies and samples.
function tfImage(s,f,t,xlbl,ylbl)
    imagesc(t,f,s)
    axis xy
    xlabel(xlbl)
    ylabel(ylbl)
    colorbar
    clim([-150 0])
end

wn = w/pi;
tfImage(s,wn,n,"Samples","Normalized Frequency (\times\pi rad/sample)")
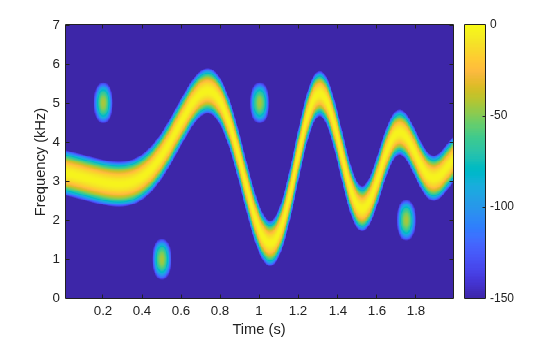
Get the STFT map to be used in time-frequency labeling. Plot the STFT along cyclical frequencies and midpoint-segment times.
[s,f,t] = getTFMap(opts,vcoOut,Fs);

fn = f/1e3;
tfImage(s,fn,t,"Time (s)","Frequency (kHz)")
Input Arguments
Output Arguments
Version History
Introduced in R2026a

