plotOnSubPlot
Plot signals on Simulink.sdi.CustomSnapshot object
subplots
Description
Examples
Copy view settings from one run to another and create figures using the Simulink.sdi.CustomSnapshot object.
Simulate Model and Get Run Object
Configure the vdp model to save output data. Run a simulation to create data.
load_system("vdp")
set_param("vdp","SaveFormat","Dataset","SaveOutput","on")
set_param("vdp/Mu","Gain","1");
sim("vdp");
Use the Simulation Data Inspector programmatic interface to access the run data.
runIndex = Simulink.sdi.getRunCount;
runID = Simulink.sdi.getRunIDByIndex(runIndex);
vdpRun = Simulink.sdi.getRun(runID);
Modify Signal View Settings
Use the Simulink.sdi.Run object to access signals in the run. Then, modify the signal view settings. This example specifies the line color and style for each signal. The view settings for the run comprise the view settings for each signal and view settings specified for the plot area.
sig1 = getSignalByIndex(vdpRun,1);
sig2 = getSignalByIndex(vdpRun,2);

sig1.LineColor = [0 0 1];
sig1.LineDashed = "-.";

sig2.LineColor = [1 0 0];
sig2.LineDashed = ":";
Capture Snapshot from Simulation Data Inspector
Create a Simulink.sdi.CustomSnapshot object and use the Simulink.sdi.snapshot function to programmatically capture a snapshot of the contents of the Simulation Data Inspector.
snap = Simulink.sdi.CustomSnapshot;
You can use properties of the Simulink.sdi.CustomSnapshot object to configure the plot settings, such as the subplot layout and axis limits, and to plot signals. When you use a Simulink.sdi.CustomSnapshot object to create your figure, these plot settings do not affect the Simulation Data Inspector.
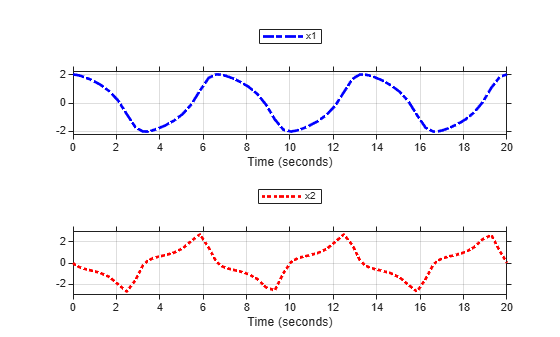
snap.Rows = 2;
snap.YRange = {[-2.25 2.25],[-3 3]};
plotOnSubPlot(snap,1,1,sig1,true)
plotOnSubPlot(snap,2,1,sig2,true)
Use the Simulink.sdi.snapshot function to generate the figure you specified in the properties of the Simulink.sdi.CustomSnapshot object.
fig = Simulink.sdi.snapshot("From","custom","To","figure","Settings",snap);
Copy View Settings to New Simulation Run
Simulate the model again, with a different Mu value. Use the Simulation Data Inspector programmatic interface to access the simulation data.
set_param("vdp/Mu","Gain",".5")
sim("vdp");

runIndex2 = Simulink.sdi.getRunCount;
runID2 = Simulink.sdi.getRunIDByIndex(runIndex2);
run2 = Simulink.sdi.getRun(runID2);
To create a plot of the new output data that looks like the one you created in the previous step, you can copy the view settings to the run in a single line of code using the Simulink.sdi.copyRunViewSettings function. This function does not automatically update plot settings in Simulink.sdi.CustomSnapshot objects, so specify the input that determines whether the plot updates as false.
sigIDs = Simulink.sdi.copyRunViewSettings(runID,runID2,false);
Capture Snapshot of New Simulation Run
Use the Simulink.sdi.CustomSnapshot object to capture a snapshot of the new simulation run. First, clear the signals from the subplots. Then, plot the signals from the new run and capture another snapshot.
clearSignals(snap)
snap.YRange = {[-2.25 2.25],[-8 8]};
plotOnSubPlot(snap,1,1,sigIDs(1),true)
plotOnSubPlot(snap,2,1,sigIDs(2),true)


fig = snapshot(snap,"To","figure");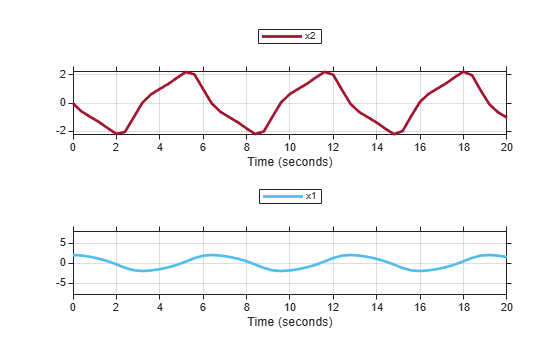
Input Arguments
Version History
Introduced in R2018a