iforest
R2026bFit isolation forest for anomaly detection
Syntax
Description
Use the iforest function to fit an isolation forest model for outlier
detection and novelty detection.
Outlier detection (detecting anomalies in training data) — Use the output argument
tfofiforestto identify anomalies in training data.Novelty detection (detecting anomalies in new data with uncontaminated training data) — Create an
IsolationForestobject by passing uncontaminated training data (data with no outliers) toiforest. Detect anomalies in new data by passing the object and the new data to the object functionisanomaly.
returns an forest = iforest(Tbl)IsolationForest
object for predictor data in the table Tbl.
specifies options using one or more name-value arguments in addition to any of the input
argument combinations in the previous syntaxes. For example,
forest = iforest(___,Name=Value) instructs the function
to process 10% of the training data as anomalies.ContaminationFraction=0.1
Examples
Detect outliers (anomalies in training data) by using the iforest function.
Load the sample data set NYCHousing2015.
load NYCHousing2015The data set includes 10 variables with information on the sales of properties in New York City in 2015. Display a summary of the data set.
summary(NYCHousing2015)
NYCHousing2015: 91446×10 table
Variables:
BOROUGH: double
NEIGHBORHOOD: cell array of character vectors
BUILDINGCLASSCATEGORY: cell array of character vectors
RESIDENTIALUNITS: double
COMMERCIALUNITS: double
LANDSQUAREFEET: double
GROSSSQUAREFEET: double
YEARBUILT: double
SALEPRICE: double
SALEDATE: datetime
Statistics for applicable variables:
NumMissing Min Median Max Mean Std
BOROUGH 0 1 3 5 2.8431 1.3343
NEIGHBORHOOD 0
BUILDINGCLASSCATEGORY 0
RESIDENTIALUNITS 0 0 1 8759 2.1789 32.2738
COMMERCIALUNITS 0 0 0 612 0.2201 3.2991
LANDSQUAREFEET 0 0 1700 29305534 2.8752e+03 1.0118e+05
GROSSSQUAREFEET 0 0 1056 8942176 4.6598e+03 4.3098e+04
YEARBUILT 0 0 1939 2016 1.7951e+03 526.9998
SALEPRICE 0 0 333333 4.1111e+09 1.2364e+06 2.0130e+07
SALEDATE 0 01-Jan-2015 09-Jul-2015 31-Dec-2015 07-Jul-2015 2470:47:17
The SALEDATE column is a datetime array, which is not supported by iforest. Create columns for the month and day numbers of the datetime values, and delete the SALEDATE column.
[~,NYCHousing2015.MM,NYCHousing2015.DD] = ymd(NYCHousing2015.SALEDATE); NYCHousing2015.SALEDATE = [];
The columns BOROUGH, NEIGHBORHOOD, and BUILDINGCLASSCATEGORY contain categorical predictors. Display the number of categories for the categorical predictors.
length(unique(NYCHousing2015.BOROUGH))
ans = 5
length(unique(NYCHousing2015.NEIGHBORHOOD))
ans = 254
length(unique(NYCHousing2015.BUILDINGCLASSCATEGORY))
ans = 48
For a categorical variable with more than 64 categories, the iforest function uses an approximate splitting method that can reduce the accuracy of the isolation forest model. Remove the NEIGHBORHOOD column, which contains a categorical variable with 254 categories.
NYCHousing2015.NEIGHBORHOOD = [];
Train an isolation forest model for NYCHousing2015. Specify the fraction of anomalies in the training observations as 0.1, and specify the first variable (BOROUGH) as a categorical predictor. The first variable is a numeric array, so iforest assumes it is a continuous variable unless you specify the variable as a categorical variable.
rng("default") % For reproducibility [Mdl,tf,scores] = iforest(NYCHousing2015,ContaminationFraction=0.1, ... CategoricalPredictors=1);
Mdl is an IsolationForest object. iforest also returns the anomaly indicators (tf) and anomaly scores (scores) for the training data NYCHousing2015.
Plot a histogram of the score values. Create a vertical line at the score threshold corresponding to the specified fraction.
histogram(scores) xline(Mdl.ScoreThreshold,"r-",["Threshold" Mdl.ScoreThreshold])
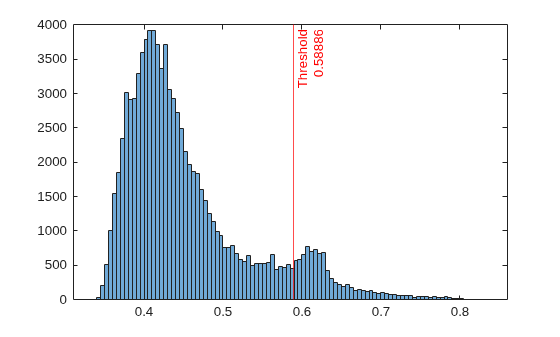
If you want to identify anomalies with a different contamination fraction (for example, 0.01), you can train a new isolation forest model.
rng("default") % For reproducibility [newMdl,newtf,scores] = iforest(NYCHousing2015, ... ContaminationFraction=0.01,CategoricalPredictors=1);
If you want to identify anomalies with a different score threshold value (for example, 0.65), you can pass the IsolationForest object, the training data, and a new threshold value to the isanomaly function.
[newtf,scores] = isanomaly(Mdl,NYCHousing2015,ScoreThreshold=0.65);
Note that changing the contamination fraction or score threshold changes the anomaly indicators only, and does not affect the anomaly scores. Therefore, if you do not want to compute the anomaly scores again by using iforest or isanomaly, you can obtain a new anomaly indicator with the existing score values.
Change the fraction of anomalies in the training data to 0.01.
newContaminationFraction = 0.01;
Find a new score threshold by using the quantile function.
newScoreThreshold = quantile(scores,1-newContaminationFraction)
newScoreThreshold = 0.7045
Obtain a new anomaly indicator.
newtf = scores > newScoreThreshold;
Create an IsolationForest object for uncontaminated training observations by using the iforest function. Then detect novelties (anomalies in new data) by passing the object and the new data to the object function isanomaly.
Load the 1994 census data stored in census1994.mat. The data set consists of demographic data from the US Census Bureau to predict whether an individual makes over $50,000 per year.
load census1994census1994 contains the training data set adultdata and the test data set adulttest.
Train an isolation forest model for adultdata. Assume that adultdata does not contain outliers.
rng("default") % For reproducibility [Mdl,tf,s] = iforest(adultdata);
Mdl is an IsolationForest object. iforest also returns the anomaly indicators tf and anomaly scores s for the training data adultdata. If you do not specify the ContaminationFraction name-value argument as a value greater than 0, then iforest treats all training observations as normal observations, meaning all the values in tf are logical 0 (false). The function sets the score threshold to the maximum score value. Display the threshold value.
Mdl.ScoreThreshold
ans = 0.8600
Find anomalies in adulttest by using the trained isolation forest model.
[tf_test,s_test] = isanomaly(Mdl,adulttest);
The isanomaly function returns the anomaly indicators tf_test and scores s_test for adulttest. By default, isanomaly identifies observations with scores above the threshold (Mdl.ScoreThreshold) as anomalies.
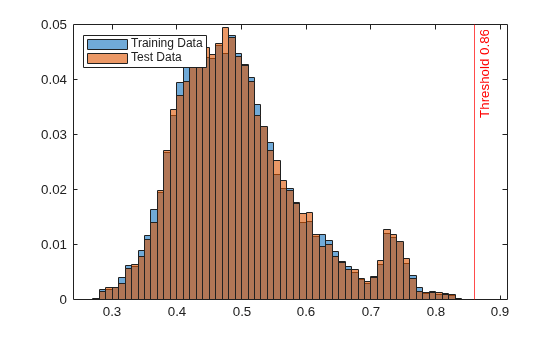
Create histograms for the anomaly scores s and s_test. Create a vertical line at the threshold of the anomaly scores.
histogram(s,Normalization="probability") hold on histogram(s_test,Normalization="probability") xline(Mdl.ScoreThreshold,"r-",join(["Threshold" Mdl.ScoreThreshold])) legend("Training Data","Test Data",Location="northwest") hold off
Display the observation index of the anomalies in the test data.
find(tf_test)
ans = 15655
The anomaly score distribution of the test data is similar to that of the training data, so isanomaly detects a small number of anomalies in the test data with the default threshold value. You can specify a different threshold value by using the ScoreThreshold name-value argument. For an example, see Specify Anomaly Score Threshold.
Input Arguments
Predictor data, specified as a table. Each row of Tbl corresponds to one observation, and each column corresponds to one predictor variable. Multicolumn variables and cell arrays other than cell arrays of character vectors are not allowed.
To use a subset of the variables in Tbl, specify the variables by using the PredictorNames name-value argument.
Data Types: table
Predictor data, specified as a numeric matrix. Each row of X corresponds to one observation, and each column corresponds to one predictor variable.
You can use the PredictorNames name-value argument to assign names to the predictor variables in X.
Data Types: single | double
Name-Value Arguments
Specify optional pairs of arguments as
Name1=Value1,...,NameN=ValueN, where Name is
the argument name and Value is the corresponding value.
Name-value arguments must appear after other arguments, but the order of the
pairs does not matter.
Example: NumLearners=50,NumObservationsPerLearner=100 specifies to
train an isolation forest using 50 isolation trees and 100 observations for each isolation
tree.
List of categorical predictors, specified as one of the values in this table.
| Value | Description |
|---|---|
| Vector of positive integers | Each entry in the vector is an index value indicating that the corresponding predictor is categorical. The index values are between 1 and If |
| Logical vector | A |
| Character matrix | Each row of the matrix is the name of a predictor variable. The names must match the entries
in PredictorNames. Pad the names
with extra blanks so each row of the character matrix has the same
length. |
| String array or cell array of character vectors | Each element in the array is the name of a predictor variable. The names must match the entries in PredictorNames. |
"all" | All predictors are categorical. |
By default, if the predictor data is a table
(Tbl), iforest assumes that a variable is
categorical if it is a logical vector, unordered categorical vector, character array, string
array, or cell array of character vectors. If the predictor data is a matrix
(X), iforest assumes that all predictors are
continuous. To identify any other predictors as categorical predictors, specify them by using
the CategoricalPredictors name-value argument.
For a categorical variable with more than 64 categories, the
iforest function uses an approximate splitting method that can
reduce the accuracy of the model.
Example: CategoricalPredictors="all"
Data Types: single | double | logical | char | string | cell
Fraction of anomalies in the training data, specified as a numeric scalar in the
range [0,1].
If the
ContaminationFractionvalue is 0 (default), theniforesttreats all training observations as normal observations, and sets the score threshold (ScoreThresholdproperty value offorest) to the maximum value ofscores.If the
ContaminationFractionvalue is in the range (0,1], theniforestdetermines the threshold value so that the function detects the specified fraction of training observations as anomalies.
Example: ContaminationFraction=0.1
Data Types: single | double
Number of isolation trees, specified as a positive integer scalar.
The average path lengths used by the isolation forest algorithm to compute anomaly scores usually converge well before growing 100 isolation trees for both normal points and anomalies [1].
Example: NumLearners=50
Data Types: single | double
Number of observations to draw from the training data without replacement for each isolation tree, specified as a positive integer scalar greater than or equal to 3.
The isolation forest algorithm performs well with a small
NumObservationsPerLearner value, because using a small sample
size helps to detect dense anomalies and anomalies close to normal points. However,
you need to experiment with the sample size if N is small. For an
example, see Examine NumObservationsPerLearner for Small Data.
Example: NumObservationsPerLearner=100
Data Types: single | double
This property is read-only.
Predictor variable names, specified as a string array of unique names or cell array of
unique character vectors. The functionality of PredictorNames depends
on how you supply the predictor data.
If you supply
Tbl, then you can usePredictorNamesto specify which predictor variables to use. That is,iforestuses only the predictor variables inPredictorNames.PredictorNamesmust be a subset ofTbl.Properties.VariableNames.By default,
PredictorNamescontains the names of all predictor variables inTbl.
If you supply
X, then you can usePredictorNamesto assign names to the predictor variables inX.The order of the names in
PredictorNamesmust correspond to the column order ofX. That is,PredictorNames{1}is the name ofX(:,1),PredictorNames{2}is the name ofX(:,2), and so on. Also,size(X,2)andnumel(PredictorNames)must be equal.By default,
PredictorNamesis{"x1","x2",...}.
Data Types: string | cell
Option to perform computations in parallel using a parallel pool of workers, specified as one of these values:
"off"— Run in serial on the MATLAB® client."auto"— Use a parallel pool if one is open or if MATLAB can automatically create one. If a parallel pool is not available, run in serial on the MATLAB client."on"— Use a parallel pool if one is open or if MATLAB can automatically create one. If a parallel pool is not available, throw an error.
If you do not have a parallel pool open and automatic pool creation is enabled, MATLAB opens a pool using the default cluster profile. To use a parallel pool to run computations in MATLAB, you must have Parallel Computing Toolbox™. For more information, see Run MATLAB Functions with Automatic Parallel Support (Parallel Computing Toolbox).
Before R2026b: To run in parallel, set
UseParallel to true.
Example: UseParallel="auto"
Data Types: char | string
Output Arguments
Trained isolation forest model, returned as an IsolationForest
object.
You can use the object function isanomaly
with forest to find anomalies in new data.
Anomaly indicators, returned as a logical column vector. An element of
tf is true when the observation in the
corresponding row of Tbl or X is an anomaly,
and false otherwise. tf has the same length as
Tbl or X.
iforest identifies observations with
scores above the threshold (ScoreThreshold property value of forest) as
anomalies. The function determines the threshold value to detect the specified fraction
(ContaminationFraction name-value argument) of training
observations as anomalies.
Anomaly scores, returned as a numeric column vector whose values are in the
range [0,1]. scores has the same length as
Tbl or X, and each element of
scores contains an anomaly score for the observation in the
corresponding row of Tbl or X. A score value
close to 0 indicates a normal observation, and a value close to 1 indicates an
anomaly.
More About
The isolation forest algorithm [1] detects anomalies by isolating anomalies from normal points using an ensemble of isolation trees.
The iforest function creates an isolation forest model (ensemble of
isolation trees) for training observations and detects outliers (anomalies in the training
data). Each isolation tree is trained for a subset of training observations as follows:
iforestdraws samples without replacement from the training observations for each tree.iforestgrows a tree by choosing a split variable and split position uniformly at random. The function continues until every sample reaches a separate leaf node for each tree.
This algorithm assumes the data has only a few anomalies and they are different from
normal points. Therefore, an anomaly reaches a separate leaf node closer to the root node
and has a shorter path length (the distance from the root node to the leaf node) than normal
points. The iforest function identifies outliers using anomaly scores that are defined
based on the average path lengths over all isolation trees.
The isanomaly function uses a trained isolation forest model to detect
anomalies in the data. For novelty detection (detecting anomalies in new data with
uncontaminated training data), you can train an isolation forest model with uncontaminated
training data (data with no outliers) and use it to detect anomalies in new data. For each
observation of the new data, the function finds the corresponding leaf node in each tree,
finds the average path length to reach a leaf node from the root node in the trained
isolation forest model, and returns an anomaly indicator and score.
For more details, see Anomaly Detection with Isolation Forest.
The isolation forest algorithm computes the anomaly score s(x) of an observation x by normalizing the path length h(x):
where E[h(x)] is the average path length over all isolation trees in the isolation forest, and c(n) is the average path length of unsuccessful searches in a binary search tree of n observations.
The score approaches 1 as E[h(x)] approaches 0. Therefore, a score value close to 1 indicates an anomaly.
The score approaches 0 as E[h(x)] approaches n – 1. Also, the score approaches 0.5 when E[h(x)] approaches c(n). Therefore, a score value smaller than 0.5 and close to 0 indicates a normal point.
Tips
After training a model, you can generate C/C++ code that finds anomalies for new data. Generating C/C++ code requires MATLAB Coder™. For details, see Code Generation section of the
isanomalyfunction page and Introduction to Code Generation for Statistics and Machine Learning Functions.
Algorithms
iforest considers NaN, '' (empty character vector), "" (empty string), <missing>, and <undefined> values in Tbl and NaN values in X to be missing values.
iforest uses observations with missing values to find splits on
variables for which these observations have valid values. The function might place
these observations in a branch node, not a leaf node. Then
iforest computes anomaly scores by using the
distance from the root node to the branch node. The function places an observation
with all missing values in the root node, so the score value becomes 1.
References
[1] Liu, F. T., K. M. Ting, and Z. Zhou. "Isolation Forest," 2008 Eighth IEEE International Conference on Data Mining. Pisa, Italy, 2008, pp. 413-422.
Extended Capabilities
The iforest function has automatic parallel support. To run
computations in parallel, set the UseParallel argument to
"on" or "auto".
For more information, see Run MATLAB Functions with Automatic Parallel Support (Parallel Computing Toolbox).
Version History
Introduced in R2021bThe UseParallel name-value argument now accepts
"off", "auto", or "on" values
instead of true or false. This change gives you more
control over when to use a parallel pool for parallel execution. Specifying the
UseParallel name-value argument as true or
false is not recommended.
This table shows how to update your code depending on your goal.
| Goal | Not Recommended | Recommended |
|---|---|---|
Write code that runs on the MATLAB client. |
UseParallel=false
|
UseParallel="off"
|
| Write portable code that runs on a parallel pool and, if a pool is not available, runs on the MATLAB client. |
UseParallel=true
|
UseParallel="auto"
|
| Write code that runs on a parallel pool and errors if a pool is not available. | N/A |
UseParallel="on"
|
There are no plans to remove support for the true or
false values.
MATLAB Command
You clicked a link that corresponds to this MATLAB command:
Run the command by entering it in the MATLAB Command Window. Web browsers do not support MATLAB commands.
Select a Web Site
Choose a web site to get translated content where available and see local events and offers. Based on your location, we recommend that you select: .
You can also select a web site from the following list
How to Get Best Site Performance
Select the China site (in Chinese or English) for best site performance. Other MathWorks country sites are not optimized for visits from your location.
Americas
- América Latina (Español)
- Canada (English)
- United States (English)
Europe
- Belgium (English)
- Denmark (English)
- Deutschland (Deutsch)
- España (Español)
- Finland (English)
- France (Français)
- Ireland (English)
- Italia (Italiano)
- Luxembourg (English)
- Netherlands (English)
- Norway (English)
- Österreich (Deutsch)
- Portugal (English)
- Sweden (English)
- Switzerland
- United Kingdom (English)