plot
R2026bDescription
ax = plot(multiSensorObj)multiSensorObj within a common reference frame, and returns the axes
handle used for plotting. The visualization includes the coordinate axes of the reference
frame and sensor icons positioned according to their respective poses.
ax = plot(multiSensorObj,Name=Value)ShowSensorName=true, displays the name of each sensor in the
visualization.
Examples
Import sensor mounting poses and intrinsic parameters from a YAML file from the Pandaset data set [1] into MATLAB® and store them in a multiSensorParameters object. The Pandaset data set uses a multi-sensor rig consisting of six cameras and two lidar sensors all rigidly mounted on the roof of a vehicle.
Download and Extract Sensor Parameters
Download the YAML file from the Pandaset Devkit [2], and save it to the current directory.
downloadURL = "https://raw.githubusercontent.com/scaleapi/pandaset-devkit/master/docs/static_extrinsic_calibration.yaml";
yamlFileName = "static_extrinsic_calibration.yaml";
websave(yamlFileName,downloadURL);
Read the YAML file using the helperParsePandasetYAML helper function, which returns a structure containing the sensor parameters. The file contains parameters for eight sensors:
Six cameras:
back_camera,front_camera,front_left_camera,front_right_camera,left_camera, andright_cameraTwo lidar sensors:
main_pandar64andfront_gt
Each sensor stores its extrinsic parameters as a rotation quaternion (w, x, y, z) and a translation vector (x, y, z). Camera sensors additionally include intrinsic parameters: a 3-by-3 camera matrix K and distortion coefficients D. The main_pandar64 lidar defines the reference frame as it is mounted at the origin.
data = helperParsePandasetYAML(yamlFileName)
data = struct with fields:
           back_camera: [1×1 struct]
          front_camera: [1×1 struct]
              front_gt: [1×1 struct]
     front_left_camera: [1×1 struct]
    front_right_camera: [1×1 struct]
           left_camera: [1×1 struct]
         main_pandar64: [1×1 struct]
          right_camera: [1×1 struct]
Add Sensor Mounting Poses and Intrinsic Parameters
Create a multiSensorParameters object to store the sensor mounting poses. In this data set, the extrinsic parameters for each sensor represent a transformation from the reference frame, which is defined by the main_pandar64 lidar sensor, to the frame of that sensor. Inverting the extrinsic parameters provides the transformation from the sensor frame to the reference frame. Use addSensor to add each sensor to the multiSensorParameters object by specifying its transformation to the reference sensor main_pandar64. For the cameras, use the cameraIntrinsicsFromOpenCV function to create cameraIntrinsics objects from their camera matrices and distortion coefficients.
% Get sensor names
sensorNames = string(fieldnames(data));

% Create multiSensorParameters object and add the reference sensor first
refSensor = "main_pandar64";
multiSensorObj = multiSensorParameters(ReferenceFrame=refSensor);
multiSensorObj = addSensor(multiSensorObj,refSensor,"lidar",rigidtform3d());

% Process each remaining sensor
for i = 1:length(sensorNames)
    sensorName = sensorNames(i);
    if sensorName == refSensor
        continue
    end
    sensorData = data.(sensorName);

    % Determine sensor type: non-camera sensors in this file are lidar
    % sensors
    if contains(sensorName, "camera")
        sensorType = "camera";
    else
        sensorType = "lidar";
    end

    % Create extrinsic parameters from quaternions and translations, then invert to get
    % the transformations from the sensor frame to the reference frame
    quat  = [sensorData.qw,sensorData.qx,sensorData.qy,sensorData.qz];
    trvec = [sensorData.tx,sensorData.ty,sensorData.tz];
    extrinsics = se3(quat,"quat",trvec);
    tformTRef  = inv(extrinsics);

    % Add each sensor to the multiSensorParameters object
    if sensorType == "camera"
        % Extract intrinsic parameters
        intrinsicsMatrix = reshape(sensorData.K,3,3)';
        distortionCoefficients = sensorData.D;

        % All cameras have the same image resolution
        imageSize = [1080 1920];

        % Create cameraIntrinsics object
        camIntrinsics = cameraIntrinsicsFromOpenCV(intrinsicsMatrix,distortionCoefficients,imageSize);

        % Add camera with intrinsics
        multiSensorObj = addSensor(multiSensorObj,sensorName,sensorType,tformTRef,refSensor, ...
            Intrinsics=camIntrinsics);
    else
        % Add sensor without intrinsics
        multiSensorObj = addSensor(multiSensorObj,sensorName,sensorType,tformTRef,refSensor);
    end
end
Visualize the sensor mounting configuration in the reference frame main_pandar64.
plot(multiSensorObj, ShowFrameAxisLabels=false);
hold off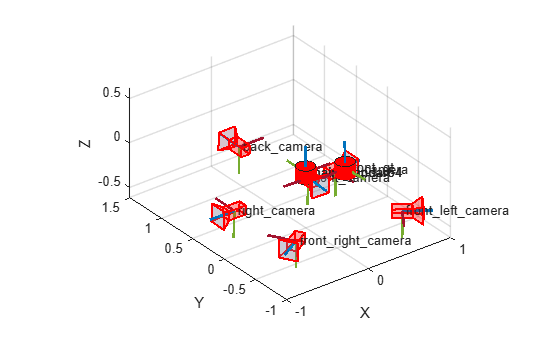
Change Reference Frame to Vehicle Coordinate System
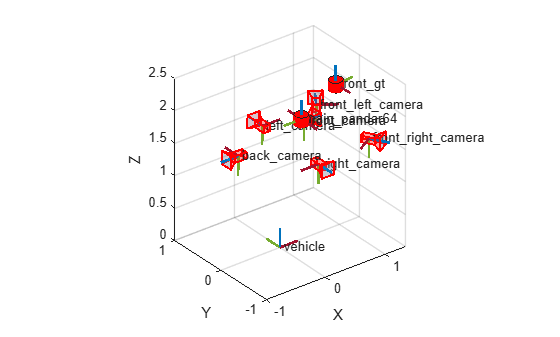
For automated driving applications, the vehicle coordinate system follows the ISO 8855 convention: the origin is on the ground directly below the midpoint of the rear axle, with the x-axis pointing forward, y-axis pointing left, and z-axis pointing up. In the Pandar64 reference frame used by your multiSensorParameters object,
, the x-axis points to the left of the vehicle and the y-axis points backward, which corresponds to a 90-degree rotation about the z-axis relative to the vehicle frame. The Pandar64 lidar sensor is mounted on the roof of the vehicle, approximately 0.36 m forward of and 1.85 m above the rear axle center. Use the changeReferenceFrame object function to transform all sensor mounting poses from the Pandar64 frame to the vehicle coordinate system.
% Pandar64 [X, Y, Z] axes correspond to [Y, -X, Z] in the vehicle frame,
% which is a 90-degree rotation about the Z-axis.
pandarRotation = [0 -1 0; 1 0 0; 0 0 1];

% Pandar64 position, in vehicle coordinates: [forward,left,up] in meters
pandarTranslation = [0.36 0 1.85];

pandarToVehicleTransform = se3(pandarRotation,pandarTranslation);
multiSensorObj = changeReferenceFrame(multiSensorObj,pandarToVehicleTransform,"vehicle");
Visualize the sensor mounting configuration in the vehicle coordinate system.
plot(multiSensorObj, ShowFrameAxisLabels=false);
References
[1] Xiao, Pengchuan, Zhenlei Shao, Steven Hao, et al. “PandaSet: Advanced Sensor Suite Dataset for Autonomous Driving.” 2021 IEEE International Intelligent Transportation Systems Conference (ITSC), September 19, 2021, 3095–101. https://doi.org/10.1109/ITSC48978.2021.9565009.
[2] Scale AI. pandaset-devkit. https://github.com/scaleapi/pandaset-devkit.
Input Arguments
Name-Value Arguments
Output Arguments
Version History
Introduced in R2026b

