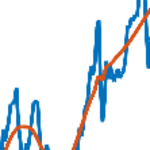
This problem is a simple version of control charts in statistics. Intput consists from 30 or more observations.
- Upper limit = mean(input) + 3 * std(input)
- Lower limit = mean(input) - 3 * std(input)
If all of the observations are between upper limit and lower limit then return true.
Solution Stats
Problem Comments
2 Comments
Solution Comments
Show comments
Loading...
Problem Recent Solvers44



Suggested Problems
-
2731 Solvers
-
First non-zero element in each column
967 Solvers
-
Return the first and last characters of a character array
12454 Solvers
-
Is this triangle right-angled?
6847 Solvers
-
Let's see how peculiar we can get
199 Solvers
More from this Author92
Problem Tags
Community Treasure Hunt
Find the treasures in MATLAB Central and discover how the community can help you!
Start Hunting!

test suite is correct, but the problem statement is incorrect. Upper limit should be mean PLUS 3 stdev, and lower limit should be minus 3 stdev.
thanks for the warning. I have corrected the problem statement.