Set colormap limits when creating m colors
Several of the colormaps are great for a 256 color surface plot, but aren't well optimized for extracting m colors for plotting several independent lines. The issue is that many colormaps have start/end colors that are too similar or are suboptimal colors for lines. There are certainly many workarounds for this, but it would be a great quality of life to adjust that directly when calling this.
Example:
x = linspace(0,2*pi,101)';
y = [1:6].*cos(x);
figure; plot(x,y,'LineWidth',2); grid on; axis tight;
And now if I wanted to color these lines, I could use something like turbo(6) or gray(6) and then apply it using colororder.
colororder(turbo(6))
But my issue is that the ends of the colormap are too similar. For other colormaps, you may get lines that are too light to be visible against the white background. There are plenty of workarounds, with my preference being to create extra colors and truncate that before using colororder.
cmap = turbo(8); cmap = cmap(2:end-1,:); % Truncate the end colors
figure; plot(x,y,'LineWidth',2); grid on; axis tight;
colororder(cmap)
I think it would be really awesome to add some name-argument input pair to these colormaps that can specify the range you want so this could even be done inside the colororder calling if desired. An example of my proposed solution would look something like this:
cmap = turbo(6,'Range',[0.1 0.8]); % Proposed idea to add functionality
Where in this scenario, the resulting colormap would be 6 equally spaced colors that range from 10% to 80% of the total color range. This would be especially nice because you could more quickly modify the range of colors, or you could set the limits regardless of whether you need to plot 3, 6, or 20 lines.
6 Comments
Time DescendingHi Emma,
You bring up a good point about how indexing into a colormap doesn't produce the most distinct colors. This is by design for two different workflows where your data is either discrete or continuous. Starting in 23b, we introduced a suite of new named color orders which were designed to be used for discrete data whereas the named colormaps you mentinoed like turbo and gray were not. In this blog post, you can see the author leverages the SeriesIndex which is a property on objects meant to leverage colororder for discrete data sets. A scatter and line object share a SeriesIndex if they are part of the same group.
As you suggested, there are current workarounds to the problem you pose but an enhancement to to make this color interpolation easier is reasonable. I just wanted to chime in to let you know that the color order colors and colormap colors were designed differently.
Unfortunately, I am still using 2023a so I can't use the predefined pallettes just yet.
I think the colormap equating to continuous data makes sense, although my suggestion would be helpful for cases where you have low resolution in one of your dimensions, or regions of missing data that you don't want to be confused with a light end of a colormap. Even just having this option would allow users to skip some adjustments to CLim that are probably common.
Thank you for highlighting the distinction between indexed colormaps and named color orders. It's interesting to learn about the new named color orders introduced in 23b, specifically tailored for discrete data sets. These are designed to offer more distinct colors compared to traditional colormaps like turbo and gray, which are better suited for continuous data.
The use of SeriesIndex to leverage color orders for discrete datasets, as discussed in the blog post, seems like a practical approach for ensuring clarity and differentiation between data groups. While there are current workarounds to address color interpolation challenges, I agree that an enhancement in this area could streamline the process further.
Your insights clarify the intentional design differences between color order colors and colormap colors, which helps in understanding their respective applications better.
MIMT ccmap() includes a number of colormaps for compatibilty purposes. These may be older versions of current maps (e.g. the original parula map from R2014b), or colormaps which are not present in older versions (e.g. turbo). It also includes all the new categorical maps generated by orderedcolors(), so there are workarounds if you don't have R2013b+.
That said, if you just want a short colortable generated from an arbitrary segment within a smooth map, then you can always just interpolate.
% parameters
n0 = 256; % something large enough
n = 12; % whatever you need for the output
outrange = [0.15 0.85];
% interpolate
CT0 = turbo(n0);
x0 = linspace(0,1,n0);
x = linspace(outrange(1),outrange(2),n);
CT = interp1(x0,CT0,x);
% visualize the colortable as an image stripe
image(permute(CT,[3 1 2]));
Of course, that won't work the same with map generators like lines(), but doing the interpolation avoids the problem where the short output length limits the resolution with which you can place the endpoint positions.
You are getting at an important distinction between a color map and a color order.
- Our color maps are designed to aid in the interpretation of continuous numeric data.
- Our color order colors are designed to differentiate a small number of discrete groups.
The very nature of a color map (like turbo or parula) is so that neighboring colors are similar and that the list of colors form a continuous transition from one color to another. That is so that when you use it to color a range of continuous numeric values, values that are close to one another are similar colors and values that are far from one another are different colors. In addition, for a well designed color map, two sets of values that are equal distance from each other will be equally distinct colors.
For example, if you have the values [1 2 100 101].
- The values 1 and 2 should be similar colors.
- The values 100 and 101 should be similar colors.
- The values 1 and 2 should be distinct colors from 100 and 101.
- Ideally, the perceptual difference in color between 1 and 2 should be similar to the perceptual difference in color between 100 and 101.
Due to this design, it turns out that it is relatively easily to programmatically/algorithmically generate a color map with an arbitrary number of colors, but using a color map for a small number of colors is unlikely to create colors that are easily distinguishable from one another, so they don't work well as color orders.
Color order colors, on the other hand, are intentionally chosen so that neighboring colors are distinct, so that when you plot two lines (for example) you can easily tell them apart. It turns out that it is actually quite difficult to generate an arbitrary number of colors that are each visually distinct from each other and asthetically pleasing. Most algorithms I've seen (see ColorBrewer for example) max out at less than a dozen colors, because beyond that it gets really difficult to pick visually distinct colors algorithmically. By the way: At least two users (here and here) have attempted to make Color Brewer available in MATLAB.
With MATLAB itself, we've had a large collection of color maps for a long time (see the colormap doc page for a list). We recently released a small number of new color orders (see the orderedcolors page for a list).
Thanks for the detailed response. I totallly understand the linking of colormaps to continuous data, but I feel like there are so many cases in which discrete data sets might still be related by a quantitative variable. In those cases, I find it useful to use the colororder as a way to present a third variable, rather than attempting to plot it in 3D using a sparsely populated variable.
In these two example images, using a colororder built from a colormap makes the overall relation much more clear than using the gem12 color pallette.
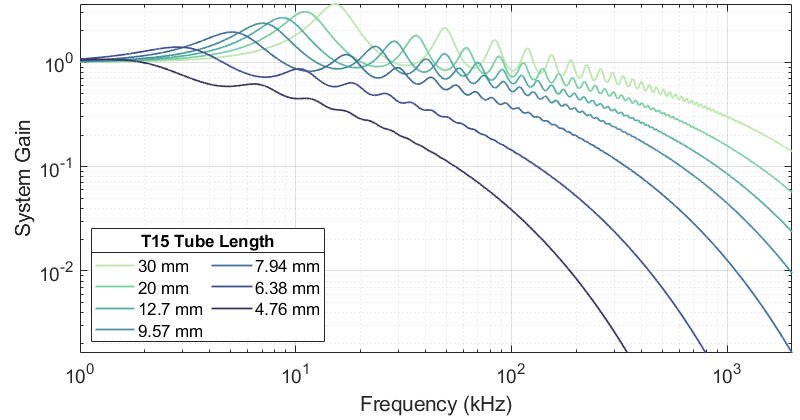
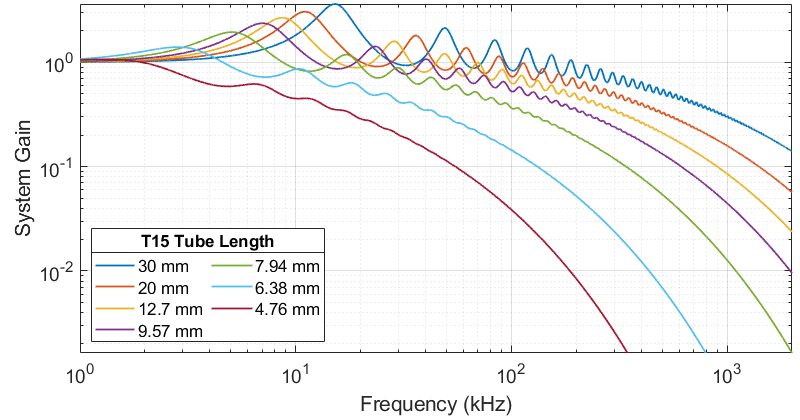
I agree that in this example, gem would likely speed up the identification of which exact line is which, but it would do so at the cost of obscuring the relation between tube length and the response. The gradient colors for this example image are uniformly spaced along a colormap, and not assigned directly based on the length value, although in other cases, that could be useful.
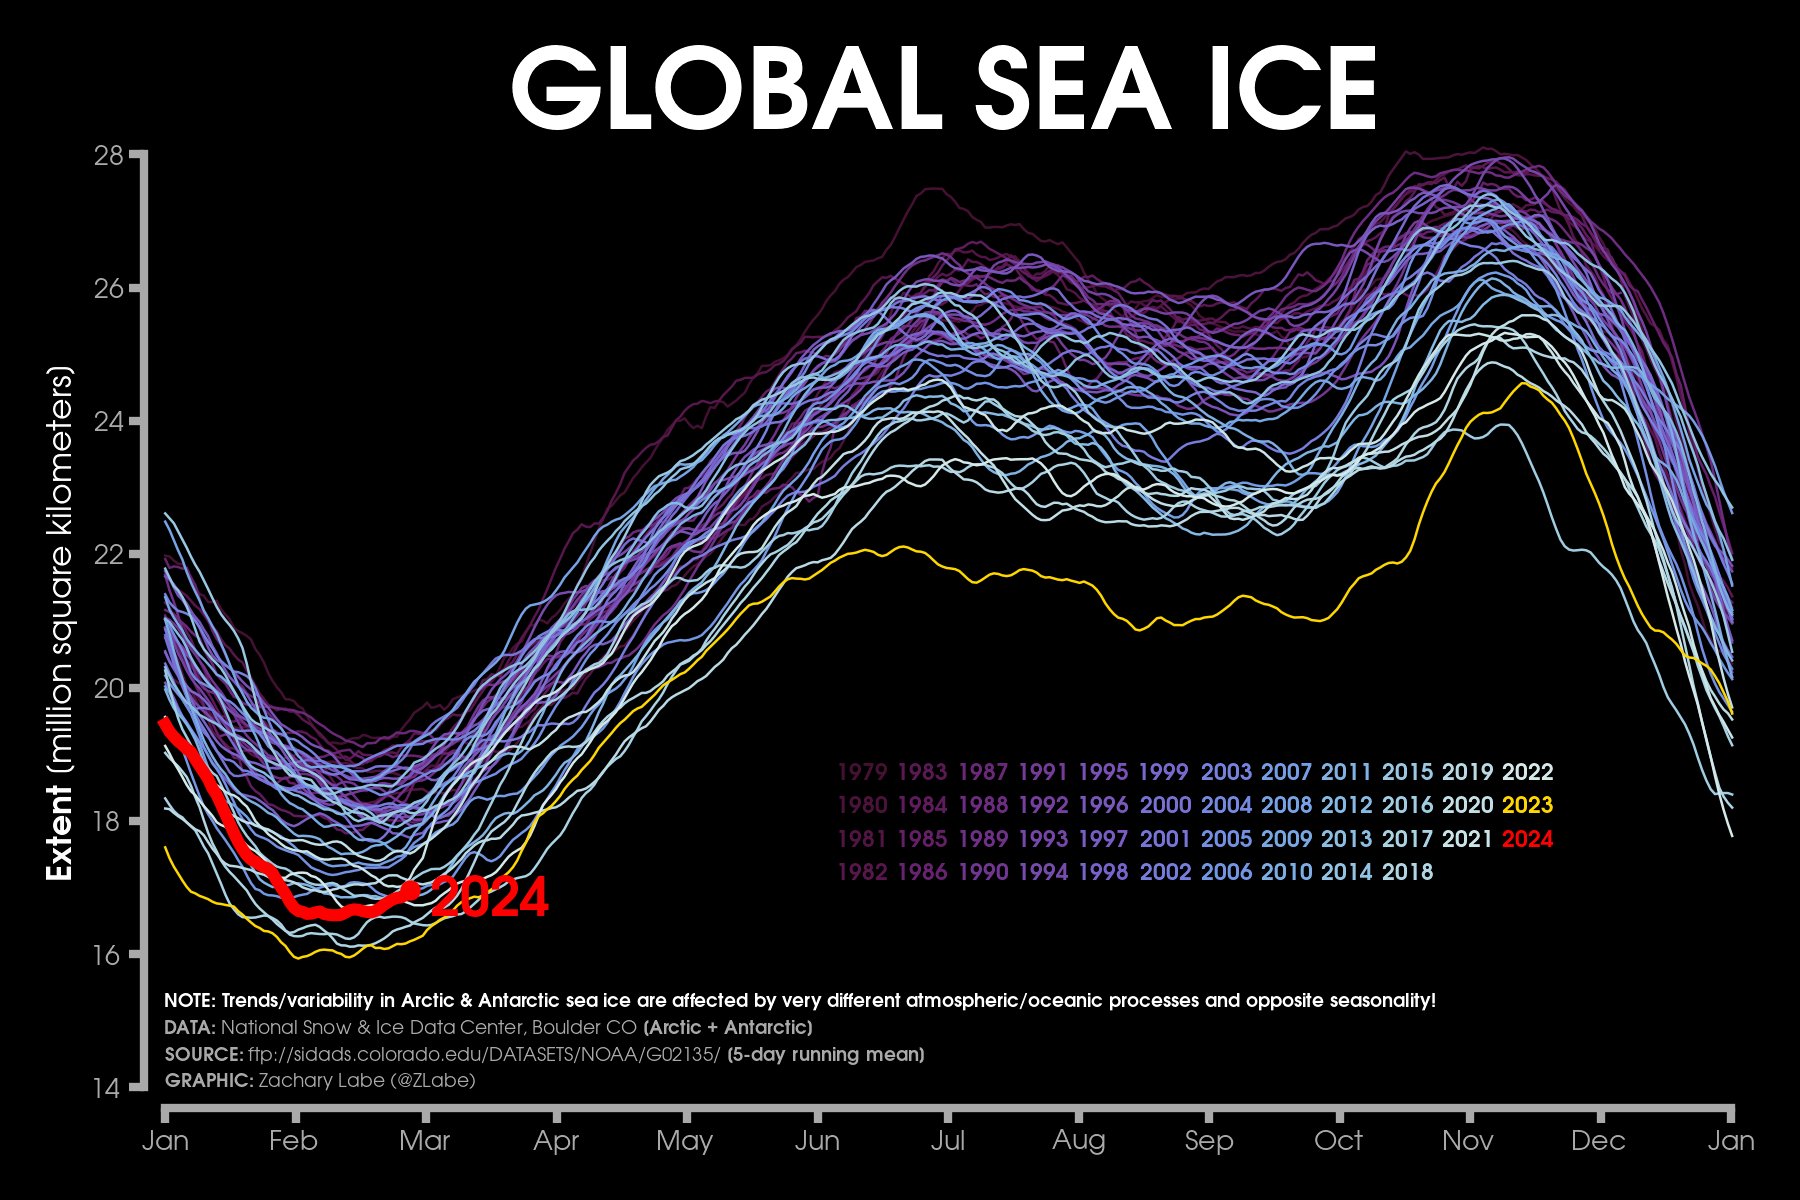
The example above is for a few colors, but the same idea is definitely used in a lot of climate change plots where there are far more than a dozen sets.
Like I initially said, it would be a nice feature even though the workarounds are simple and straightforward. Plus it is clearly even a consideration for the ColorBrewer links that you attached given their inclusion of segmented versions of their colormaps (although I tend to use the cmocean package for my non-standard colormaps).
Sign in to participate