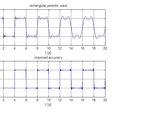
A fuzzy T-S Modeling App in three different languages.

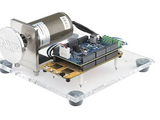
High-fidelity digital twins of Quanser’s world renowned controls, mechatronics, and robotics hardware for teaching and research.
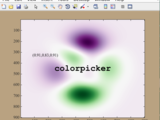
Get RGB values of any point(s) on a figure from mouse click(s)
colorpicker gets RGB values from mouse clicks anywhere on a figure. PressReturn to exit. % Syntax colorpicker colorpicker(256) colorpicker(...,TextProperty,TextValue) RGB = colorpicker(...) [R,G,B
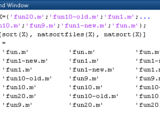
Alphanumeric sort of filenames or filepaths, with customizable number format.
To sort the elements of a string/cell array use NATSORT: http://www.mathworks.com/matlabcentral/fileexchange/34464-customizable-natural-order-sortTo sort the rows of a string/cell array use

Solves weighted absolute orientation problem using Horn's quaternion-based method.
general problem min. sum_i w(i)*||s*R*A(:,i) + t - B(:,i)||^2 where s>=0 is an unknown global scale factor to be estimated, along with R and t, and w is a user-supplied N-vector of weights. One can
A set of functions for labeling and manipulating groups of consecutively repeating elements in a vector.
A collection of utilities to complement the RF Toolbox.
This is a collection of RF centric utilities that complement and extend RF Toolbox functions. The list includes:1)One Port (s1p) file viewer (Smith, SWR/Q, Real(Z)&Imag(Z), Mag(Z) and Phase(Z
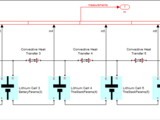
Lithium ion battery characterization, state estimation, cell balancing, and thermal management
Effecthttps://www.mathworks.com/content/dam/mathworks/tag-team/Objects/i/71900-ieee-2012-high-fidelity-lithium-battery-model-with-thermal-effect.pdf SAE 2013: Simplified Extended Kalman Filter Observer for Battery SOC Estimationhttps://www.mathworks.com/content/dam/mathworks/tag-team/Objects/s/76108-sae-2013-simplified-ekf-battery-model.pdf SAE
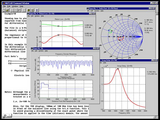
Routines for Smith Chart, TDR, Mixed-Mode S-params, Matching
as a function of distance.The routines that deal with input impedance use the form Zin=A+jB Ohms,rather than the reflection coefficient S11,S22 etc. This is simply becauseI feel it is easier and more

This package represents the MATLAB Installer add-on for the FREE of cost, NXP’s Model-Based Design Toolboxes.
Note: It is recommended to uninstall and delete all files/folder of the older versions of NXP Model-Based Design S32K1xx Toolbox before installing the new versions.The steps to install NXP
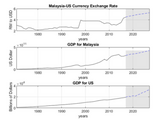
Models VAR using GDP for Malaysia, GDP for U.S. and Malaysia/U.S. Foreign Exchange Rate
This example use https://www.mathworks.com/help/econ/var-model-case-study.html as reference.Highlights : Loading data from FRED and transforming the data for stationarityPartitioning the transformed
EDITDIST finds the edit distance between strings s1 and s2.
EDITDIST finds the edit distance between strings s1 and s2. The Edit Distance is defined as the minimum number of single-character edit operations (deletions, insertions, and/or replacements) that
Animates the process of S Transform
It depicts the moving window and atom of S transform, using a predefined chirp as the input signal.
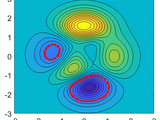
draws a t-s diagram for given temperature and salinity data
t-s diagram is very useful for determining water mass property in physical oceanography. This program helps to plot the T-S diagram with density contours in the background. it used external code
International Reference Ionosphere 2012 model
STRUCT2MAT Converts a structure into a matrix.
array 'n'. If the fields of S aren't of the same length, the columns of X will be padded with NaN.Example:s= struct('a',['string of letters'],'b',[1 2; 3 4],'c',[1 2 3 4 5 6 7 8 9])[x,n]= struct2mat(s)
A simple C S-function which reads data from a file during simulation.
S-functions are used to create user defined blocks in Simulink. This S-function creates a block that reads data from a file incrementally at each time step of the Simulink simulation.The S
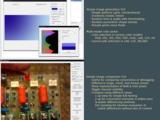
MATLAB Image Manipulation Toolbox
if they have been useful to me, then surely they'll be useful in part to someone else. This was written and tested in R2009b, R2015b, and R2019b. Some effort has been made to make sure most tools
returns those subsets (= combinations of elements of a set) that fulfill a specific criterion
W = nchoosecrit(S, FUN) returns those combinations of one or more element of the set S (called a subset) that fulfill a specific criterion. This criterion is specified by the function FUN. FUN is a
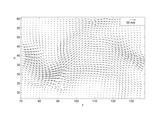
Quiver vector plot with reference vector showing scale
Use a single Simulink s-function block to access multiple s-functions.
Allow users to switch between multiple s-functions from popup menu. The s-functions used in this example block ship with Simulink.For more details, edit block mask and examine the parameters tab
a unix-like, very fast grep utility to find strings(s) in files of any type
a fast grep utility, which finds string pattern(s) in all or selected files of any type in a folder and its subfolders (if the recursion flag -r is set).file access and string matching are optimized
Problem from Engineering Optimization By S.S. Rao
Engineering Optimization By S.S. Rao Page No. : 289Algorithm and Hand Calculation Available in this text book
Plot T,s; h,s or log p,h-Diagrams of Water within MATLAB
You can plot your own T,s; h,s or log p,h-Diagrams of water in MATLAB with the function thermo_diagram_plot.m.The function makes use of Magnus Holmgrens work available at

Computes intersection points of two curves.
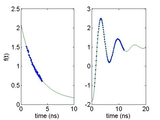
Fits 1) f=s1+s2*exp(-t/s3) or 2) f=s1+s2*exp(-t/s3)+s4*exp(-t/s5) to numerics, without startguess
f=s1+s2*exp(-t/s3) --- caseval = 2 (general case, two exponentials) ---- f=s1+s2*exp(-t/s3)+s4*exp(-t/s5) --- caseval = 3 ---- f=s1*(1-exp(-t/s2)) %i.e., constraints between s1 and s2 Syntax

Complete Stochastic Modelling Solution (CoSMoS)
CoSMoS-MATLAB is a MATLAB package that makes time series generation with desired properties easy. Just choose the characteristics of the time series you want to generate, and it will do the rest. The
Field-Oriented Control of Permanent Magnet Synchronous Motor Using NXP™ S32K144 Development kit
FOC-of-PMSMField-Oriented Control of Permanent Magnet Synchronous Motor Using NXP™ S32K144 Development kitThis example implements a motor control system using the NXP™ MCSPTE1AK144 hardware. The
Interactive tool allowing the measurement of distances, radii, and angles in images
Matlab FileExchange since November 2009, the corresponding website can be found here:http://www.mathworks.com/matlabcentral/fileexchange/25964-image-measurement-utility. Recently, that site is linked to
Interpolates (& extrapolates) NaN elements in a 2d array.
Image Processing Tutorial to demonstrate the basic concepts to beginner users.
because it demonstrates some functions supplied by that toolbox, plus it uses the "coins" demo image supplied with that toolbox.Tested with R2008b through R2022a.
Numerical approximation of the inverse Laplace transform for use with any function defined in "s".
This set of functions allows a user to numerically approximate an inverse Laplace transform for any function of "s". The function to convert can be passed in as an argument, along with the desired
Computes nearest neighbour(s) by Euclidean distance
This course is an introduction to modeling and simulation (8 chapter, more than 90 models and scripts) MATLAB, SImulink, SImscape, Stateflow

This algorithm is a basic example that will help to construct a deep belief neural network with Extreme Learning Machine rules (i.e OSELM))
Engineering 221: 108525. https://linkinghub.elsevier.com/retrieve/pii/S0029801820314323.% Berghout, Tarek et al. 2020. “Aircraft Engines Remaining Useful Life Prediction with an Adaptive Denoising Online

Toolbox leveraging interface to ANSYS aaS products
This toolbox leverages interface to ANSYS aaS products (ANSYS Workbench, ANSYS Mechanical APDL and ANSYS Fluent). © 2023-2024 ANSYS, Inc. Unauthorized use, distribution or duplication is prohibited
Convert between N-port representations of RF circuits. Read / Write industry-standard files.
frequencies !Have fun !p.s. any ideas ? bugs ? email me
Recursive function designed to display the 'branch' structure of struct variables.
getStockSymbols obtains symbols in U.S. stock markets or symbols of U.S. index components.
getStockSymbols obtains symbols in U.S. stock markets or symbols of U.S. index components. The function also outputs the company name, sector type, market cap, p/e, last price, last price percent
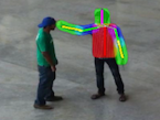
Autonomous UAV for Suspicious Action Detection using Pictorial Human Pose Estimation and Classificat

Convert velocities between mph, m/s,km/h, kts, ft/s
per second 3. Kilometers per hour 4. Knots (nautical miles per hour) 5. Feet per second (U.S. survey feet)These functions are called much like their distance-converting counterparts (i.e. nm2km
Transform colors between sRGB, YCbCr, YPbPr, YUV, YIQ, HSV, HSL, HSI, XYZ, Lab, Luv, LCH, CAT02 LMS
This package converts colors between sRGB, Y'PbPr, Y'CbCr, JPEG-Y'CbCr, Y'UV, Y'IQ, Y'DbDr, HSV, HSL, HSI, CIE XYZ, CIE L*a*b* (CIELAB), CIE L*u*v* (CIELUV), and CIE L*ch (CIELCH), and CIE CAT02 LMS
2 dimensional Stockwell transform, (S-transform), (DOST2)
original signal from its Stockwell coefficients; 3) dost2_tutorial.m: it provides an example on how to use the 2-dimensional S-transform to analyze the classical "lena picture".The DOST2 and IDOST2 are

MATLAB App for rational fitting of 2 ports S-parameters.
Use this App to graphically fit 2 port S-parameters using RF Toolbox function rationalfit.

A toolbox to implement Spherical Self-Organizing Feature Maps
Self-Organizing Feature Maps (SOFMs). It is freely distributable for educational and research purposes.Example:% loads the data to be visualizedload henon-1024-4.mat %loads the S
Get a table of contour line coordinates from a contour object.
POLYPARCI calculates confidence intervals for parameters estimated by ‘polyfit’.
‘polyfit’). As with the earlier version, it is self-contained, requires only MATLAB, and does not requre any additional Toolboxes. It is written with 2023b, however it should be backward-compatible to at
Adds mex support for Microsoft’s latest compiler.
Generate Matlab table for ticker(s) queried through Alphavantage
latest upload date, all 'functions' appear to download correctly and format nicely into tabular data. The 'sector' query was particularly devilish to format. Version 2016b requires voiding of web secure
Rotate three-dimensional vector(s) about a specified axis by a specified angle.
The function f(t)=INVLAP(F(s)) inverts Laplace transforms very effectively.
Inversion of Laplace transforms is a very important procedure used in solution of complex linear systems. The function f(t)=INVLAP(F(s)) offers a simple, effective and reasonably accurate way to
Efficient nonlinear regression fitting using a constrained, partitioned least squares overlay to fmi
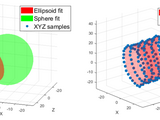
A tool set for fitting and/or plotting various conics and quadric surfaces, e.g., ellipses, cylinders, spheres, planes, cones, and lines.
Matlab codes for the sEMG Basic Hand Movements
These are the matlab codes used for the development of the article "Improving sEMG-based hand gesture recognition using Maximal Overlap Discrete Wavelet Transform and an Autoencoder Neural Network
circular convolution using Discrete sine and cosine transforms
Matlab code for the algorithm published inV. G. Reju, S. N. Koh and I. Y. Soon, Convolution Using Discrete Sine and Cosine Transforms, IEEE Signal Processing Letters, VOL. 14, NO. 7, JULY 2007

Random permutation of array elements, C-Mex: much faster than RANDPERM
6.5, 7.7, 7.8, 32bit, WinXP,Compiler: LCC 2.4/3.8, BCC 5.5, Open Watcom 1.8, MSVC 2008.Compatibility to 64 bit, Linux and Mac is assumed.Pre-compiled Mex: http://www.n-simon.de/mex
Extract/visualize level set(s) of a scalar field defined at the vertices of a surface mesh
IsoCutIsoCut Toolbox is a set of Matlab functions that let you (a) extract and visualize level sets of scalar fields defined at the meshvertices, and (b) if necessary, locally modifying mesh
Vicon Tracker S Function and Simulink Model Samples
very small subset of the data available via the DSSDK.All of the examples consist of an s-function along with a Simulink model showing a block using the custom s-function in a simulation.Single object
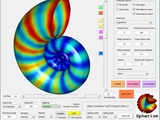
Wield the power of OpenGL and create ammonites, Klein bottles and curious spheria!
You can also select a web site from the following list
Americas
- América Latina (Español)
- Canada (English)
- United States (English)
Europe
- Belgium (English)
- Denmark (English)
- Deutschland (Deutsch)
- España (Español)
- Finland (English)
- France (Français)
- Ireland (English)
- Italia (Italiano)
- Luxembourg (English)
- Netherlands (English)
- Norway (English)
- Österreich (Deutsch)
- Portugal (English)
- Sweden (English)
- Switzerland
- United Kingdom (English)
Asia Pacific
- Australia (English)
- India (English)
- New Zealand (English)
- 中国
- 日本Japanese (日本語)
- 한국Korean (한국어)