Radar Toolbox Support Package for Texas Instruments mmWave Radar Sensors
Acquire radar data from Texas Instruments millimeter wave sensor evaluation modules
Using the Radar Toolbox Support Package for Texas Instruments® mmWave Radar Sensors you can communicate with Texas Instruments millimeter wave (mmWave) Sensor Evaluation Modules (EVMs), configure
- 971 (All time)
- 44 (Last 30 days)
- 5.0 / 5
- MathWorks
-
17 Jun 2026

MATLAB Simulations for Radar Systems Design
MATLAB Simulations for Radar Systems Design
Comprehensive set of *.m files and function, including GUI, to calculate and plot Radar design and analysis issues. This include, the radar equation, radar waveform analysis, pulse compression
- 50.9K (All time)
- 21 (Last 30 days)
- 4.5 / 5
- Community
-
25 Apr 2016

Creating a radar datacube for single or multiple targets
This program creates a radar datacube using functions from the PhasedArray System Toolbox. This program shows 2 examples: 1- A radar datacube with a single target, an 8 element uniform linear array
- 2K (All time)
- 4 (Last 30 days)
- 5.0 / 5
- Community
-
1 Sep 2016

- 547 (All time)
- 1 (Last 30 days)
- 5.0 / 5
- Community
-
13 Oct 2016

Markov Chain Model of RADAR Detector
This model, radar_detector.mdl, simulates a Markov Chain representation of a police officer looking for speeding cars to ticket. A ticket can be given if the speed was determined within eight seconds
- 8.4K (All time)
- 3 (Last 30 days)
- 4.4 / 5
- Community
-
1 Sep 2016
an early warning RADAR simulation
I made this simulation as a project in a course I took in RADAR basic concepts.Short explanation: This is an early warning radar simulation.The simulation simulates the targets behavior and
- 35K (All time)
- 16 (Last 30 days)
- 4.5 / 5
- Community
-
10 Apr 2008
Plot a radar-like display from distance and direction vectors.
Take a set of speed or distance data with a direction and create a radar-like plot...
- 2.3K (All time)
- 2 (Last 30 days)
- 5.0 / 5
- Community
-
21 Sep 2010

FPGA-Adaptive-Beamforming-and-Radar-Examples
This repository contains FPGA/HDL demonstrations several beamforming and radar designs. Simulink models and MATLAB reference code are provid
This repository contains FPGA/HDL demonstrations several beamforming and radar designs. Simulink models and MATLAB reference code are provided to showcase high-level simulation and HDL designs of
- 1.2K (All time)
- 8 (Last 30 days)
- 4.8 / 5
- Community
-
14 Aug 2023

WR-TSS: Weather Radar Time-Series Simulation
Functions for accurate and efficient simulation of weather radar time series.
WR-TSS (Weather Radar Time-Series Simulation) is a set of functions for simulating weather radar time-series data using a Gaussian signal model. WR-TSS is focused on simulating a large number of
- 369 (All time)
- 4 (Last 30 days)
- 5.0 / 5
- Community
-
11 Aug 2025

- 14.4K (All time)
- 9 (Last 30 days)
- 4.9 / 5
- Community
-
21 Nov 2002

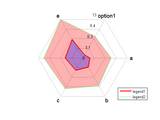
Create a spider or radar plot with individual axes.
MATLAB Online](https://www.mathworks.com/images/responsive/global/open-in-matlab-online.svg)](https://matlab.mathworks.com/open/github/v1?repo=NewGuy012/spider_plot)# spider_plotCreate a spider or radar
- 16.5K (All time)
- 90 (Last 30 days)
- 4.9 / 5
- Community
-
19 Apr 2026
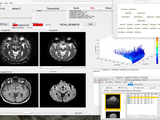
MP3 a medical imaging toolbox (MRI, CT, PET...)
Medical software for Processing multi-Parametric images Pipelines
- 1.3K (All time)
- 21 (Last 30 days)
- 5.0 / 5
- Community
-
18 Aug 2023

Developed FM-CW Radar approach
this project correct the error which occur in the previous project
One of the most disadvantages of continues radar system that it cannot calculate range because the time of transmitting the signal is unknown so we used one of communication system techniques
- 2.1K (All time)
- 2 (Last 30 days)
- 5.0 / 5
- Community
-
27 Mar 2012
GUI for exploring the FMCW radar signals and the use of FFT's
The radarExplorer GUI is used to simulate the measured backscattered signal from simple point scatterers. Additionally, the software can be used to explore the use of the FFT, and the effects of
- 809 (All time)
- 3 (Last 30 days)
- 4.0 / 5
- Community
-
17 Jan 2015
Perform Beamforming, Pulse Compression and Doppler Processing on radar data
This program processes a radar datacube using functions from Phased ArraySystem Toolbox. The program first creates a radar datacube for a singletarget at 20 km distance, 30 degree azimuth and 150
- 1.7K (All time)
- 1 (Last 30 days)
- 5.0 / 5
- Community
-
1 Sep 2016
doppler radar signal processing unit
system is application on fft and filter
- 1.7K (All time)
- 3 (Last 30 days)
- 5.0 / 5
- Community
-
27 Nov 2012

Emitter Detection and Geolocation for Electronic Warfare
MATLAB code companion to Emitter Detection and Geolocation for Electronic Warfare (Artech House, 2019)
- 1.4K (All time)
- 5 (Last 30 days)
- 4.8 / 5
- Community
-
21 May 2023

FMCW radar multiple moving target detection
This program form an image for multiple moving target through the Least Square method. It can simultaneously imaging for many targets.
- 1.6K (All time)
- 4 (Last 30 days)
- 5.0 / 5
- Community
-
27 Jun 2020

STAP optimal processing for radar
- 914 (All time)
- 2 (Last 30 days)
- 5.0 / 5
- Community
-
5 Aug 2014
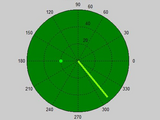
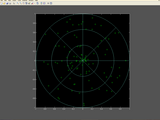
Radar Plan Position Indicator (PPI)
This function simulates the Plan Position Indicator plot for tracking of a target in a radar system.
This function simulates Radar Plan Position Indicator plot. It can be used to detect a target which falls in the maximum detectable range of the radar system. Given the values of the distance of the
- 3.6K (All time)
- 7 (Last 30 days)
- 4.0 / 5
- Community
-
17 Jan 2013
Modeling and Simulating Radar Systems Using MATLAB and Simulink
Contains code snippets used in the webinar
This submission contains the MATLAB code and Simulink models used in the Modeling and Simulating Radar Systems Using MATLAB and Simulink on 12 March 2013. Radar system design requires multi-domain
- 7.4K (All time)
- 9 (Last 30 days)
- 4.9 / 5
- Community
-
1 Sep 2016
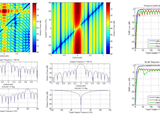
Space-Time Adaptive Processing for Airborne Radar by J.Ward
Reproduction of J.Ward's Technical Report 1015 figures.
figures from the following chapters have been reproduced:Chapter 2: Airborne Array Radar Signal Environment.Chapter 3: Space-Time Processing Fundamentals.Chapter 5: Element-Space STAP.Chapter 6: Beamspace
- 3.9K (All time)
- 12 (Last 30 days)
- 5.0 / 5
- Community
-
23 Sep 2018

Plots a radar (spider) chart (no need of circle function here)
- 3K (All time)
- 2 (Last 30 days)
- 3.7 / 5
- Community
-
4 Sep 2008
Loads and saves rd3 files (ground penetrating radar).
A zip file that contains routines to load and save rd3 files (a format used for ground penetrating radar data). loadrd3: to load rd3 filerd3info: retrieve info from the rad file accompanying the rd3
- 3.6K (All time)
- 2 (Last 30 days)
- 5.0 / 5
- Community
-
29 Oct 2004

spiderplot(X, axisMax, axisMin, colors)
Creates a spider (radar) plot
SPIDERPLOT(X), where X is a M times N matrix, plots N radar plots to a figure with M axis.SPIDERPLOT(X [MxN], AXISMAX [Mx1], AXISMIN [Mx1], COLORS [Nx1 or Nx3]) uses AXISMIN and AXISMAX to scale the
- 5.3K (All time)
- 1 (Last 30 days)
- 4.5 / 5
- Community
-
1 Sep 2016

Synthetic Aperture Radar Signal Processing with MATLAB Algorithms
Companion Software
- 31.5K (All time)
- 17 (Last 30 days)
- 4.7 / 5
- Community
-
31 Mar 2016
Radar System Design and Analysis with MATLAB: Webinar
MATLAB source code of examples showcased in this webinar
In this webinar we illustrate techniques for designing and analyzing radar systems. You’ll see how you can perform radar system design and analysis tasks such as waveform design, target detection
- 5.6K (All time)
- 5 (Last 30 days)
- 4.2 / 5
- Community
-
1 Sep 2016

- 14.8K (All time)
- 7 (Last 30 days)
- 4.3 / 5
- Community
-
7 Mar 2008

Highly customizable radar chart plotting.
Demo1X = randi([-3, 8], [4, 7]) + rand([4, 7]);% Create radar chart object.RC = radarChart(X);% Set R-axis limit and ticks.RC.RLim = [-5,10];RC.RTick = [-5,2,8,10];% Draw radar chart.RC = RC.draw
- 592 (All time)
- 19 (Last 30 days)
- -- / 5
- Community
-
19 Apr 2026
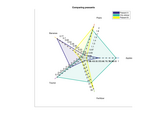
Spider(rader) Chart for Multi Data
Plots a radar (spider) chart for Multi-Data (no need of circle function here)
Plots a radar (spider) chart for Multi-Data.with changeable Label, LineColor, FillColor and LineStyle.
- 3.8K (All time)
- 6 (Last 30 days)
- 5.0 / 5
- Community
-
7 Feb 2011
Calculates the Beat Frequency for a FMCW Radar Sensor
Calculates the Beat Frequency for a FMCW Radar Sensor
- 523 (All time)
- 3 (Last 30 days)
- -- / 5
- Community
-
25 Jan 2015

Polygonal (radar) plot with mean and standard deviation (or error) values
- 499 (All time)
- 3 (Last 30 days)
- 5.0 / 5
- Community
-
29 Jan 2020
Transform radar coordinates (Range, Azimuth, Elevation) to Cartesian coordinates (East, North, Up)
A variation of Matlab's sph2cart, that transforms a vector of radar coordinates (Range, Azimuth, Elevation) to Cartesian coordinates (East, North, Up). Note the different definition of radar coords
- 4.8K (All time)
- 1 (Last 30 days)
- 5.0 / 5
- Community
-
24 Aug 2007

approach for fm-cw radar system
the model explain the basic principle of frequency modulated continouse wave radar system and it contains how effect of noise affected on system
- 2.2K (All time)
- 8 (Last 30 days)
- 3.0 / 5
- Community
-
22 Mar 2012

POFACETS calculates the monostatic or bistatic radar cross section (RCS) of meshed targets.
POFACETS calculates the monostatic or bistatic radar cross section (RCS) of meshed targets. Simple target models can be created in POFACETS or imported from meshed CAD models. The RCS calculation
- 2.7K (All time)
- 36 (Last 30 days)
- 5.0 / 5
- Community
-
17 Feb 2023

This script simulates the operation of an FMCW radar for a single chirp.
This script simulates the operation of an FMCW radar for a single chirp.
- 372 (All time)
- 8 (Last 30 days)
- -- / 5
- Community
-
28 Aug 2023

- 5.6K (All time)
- 1 (Last 30 days)
- 4.0 / 5
- Community
-
27 Sep 2010
Radar Cross Section of an Infinite Cylinder
Compute the radar cross section of an infinite cylinder using a modal solution
Computes the radar cross section and excited surface currents of an infinitely long, conducting cylinder.Follows the treatment in Chapter 4 ofRuck, et. al. "Radar Cross Section Handbook", Plenum
- 2.6K (All time)
- 1 (Last 30 days)
- -- / 5
- Community
-
9 Jul 2008

Implements a basic range-Doppler algorithm for focusing raw synthetic aperture radar (SAR) data
- 4K (All time)
- 4 (Last 30 days)
- 5.0 / 5
- Community
-
7 Apr 2022

Radar Signal Simulation of Wind Turbines
A flexible wind turbine time-series IQ signal simulator to characterize signatures received at a radar system.
A flexible wind turbine time-series IQ signal simulator to characterize signatures received at a radar system. It is a simplified version of the simulation used in this article: D. Schvartzman
- 110 (All time)
- 3 (Last 30 days)
- -- / 5
- Community
-
17 Mar 2023

This toolbox represents the MATLAB Installer Add-On for the NXP RADAR Toolbox for S32R
To install the NXP RADAR Toolbox for S32R, please follow these steps:1. Go to MATLAB Add-On Manager and select the NXP Support Package S32R toolbox.2. Select Open Folder option to navigate to the
- 1.3K (All time)
- 17 (Last 30 days)
- 5.0 / 5
- Community
-
2 Jul 2025

- 453 (All time)
- 1 (Last 30 days)
- -- / 5
- Community
-
16 Jul 2024

Point targets stepped frequency radar imaging example
Simple stepped frequency Inverse Furrier Transform point radar targets imaging live script simulation and target distance measurements.
POINT TARGETS STEPPED FREQUENCY RADAR IFFT IMAGING EXAMPLEIn the radar stepped frequency IFFT live script simulation user can interactively change radar parameters (carrier frequency and bandwidth
- 163 (All time)
- 2 (Last 30 days)
- -- / 5
- Community
-
2 Sep 2021

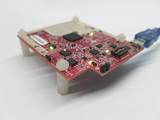
Radar Toolbox Add-On for Analog Devices TinyRad
Add-On enabling the communication between MATLAB & Simulink and the Analog Devices TinyRad Radar Sensor Platform
The Radar Toolbox Add-On for Analog Devices TinyRad enables the communication between MATLAB®/Simulink®, and Analog Devices® TinyRad (EV-TINYRAD24G) Radar Sensor Platform. This Add-On enables the
- 158 (All time)
- 9 (Last 30 days)
- -- / 5
- Community
-
13 Dec 2022

2024 MATLAB Student AI Challenge
Readme실행할 코드: radar_DSP_system, Tracking_and_CNN, Result_Probability함수 코드: 나머지#######################################################실행 순서 radar_DSP_system -> Tracking_and_CNN ->
- 54 (All time)
- 2 (Last 30 days)
- -- / 5
- Community
-
30 Jul 2024

Phased Array System Toolbox Add-On for Demorad
Add-On enabling the communication between MATLAB & Simulink and the Analog Devices Demorad Radar Sensor Platform
The Phased Array System Toolbox(TM) Add-On for Demorad enables communication between MATLAB(R) and an Analog Devices(R) Demorad Radar Sensor Platform. This Add-On enables the user to configure the
- 991 (All time)
- 13 (Last 30 days)
- 5.0 / 5
- Community
-
9 Oct 2019

Laser Radar (LADAR) Simulator Matlab Application
This (Laser Radar) LADAR simulator (V2) App has been developed, using MATLAB and its graphical user interface to simulate LADAR systems.
Approach.This (Laser Radar) LADAR simulator (V2) App has been developed, using MATLAB and its graphical user interface to simulate LADAR systems, and to produce 3D simulated scanning images under a wide variety
- 16 (All time)
- 2 (Last 30 days)
- -- / 5
- Community
-
2 Sep 2025

Digital Chirp Generator for 77GHz Radar Transmitter
Simulink model for high frequency resolution chirp generator for mmwave radar transmitter is presented using single N-PLL.
A high resolution 77GHz linear chirp signal synthesizer for Monostatic Frequency Modulated Continuous Wave (FMCW) Radar is presented. The simulated design uses a single PLL for 77GHz chirp output as
- 470 (All time)
- 2 (Last 30 days)
- -- / 5
- Community
-
6 Dec 2019
Calculation of radar cross section (RCS) using mie theory
This function calculates radar cross section (RCS) of the scattering of a object using mie theory.
The function calculates radar cross section (RCS) of the scattering of a object based on mie theory. Its accuracy is tested.
- 1.7K (All time)
- 1 (Last 30 days)
- 3.0 / 5
- Community
-
6 Apr 2012
Calculating SNR of radar by using various parameters
This example calculates the SNR of a radar by using different parameters for two different RCS and plots SNR vs Range graph
This example calculates the SNR of a radar by using different parameters for two different RCS and plots SNR vs Range graph and in the code these parameters are defined separately assuming a
- 54 (All time)
- 1 (Last 30 days)
- -- / 5
- Community
-
1 Jun 2023

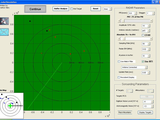
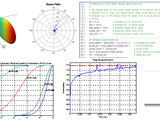
Provides a GUI for basic radar calculations and provides analysis for far-field aperture views and Doppler processing.
RCAM (Radar Calculation and Analysis for MATLAB) provides a GUI for basic radar calculations and provides analysis for far-field aperture views and Doppler processing. The paper that documents the
- 562 (All time)
- 3 (Last 30 days)
- 5.0 / 5
- Community
-
29 Oct 2018

This package represents the MATLAB Installer add-on for the FREE of cost, NXP’s Model-Based Design Toolboxes.
Following are the steps to install NXP’s Model-Based Design Toolbox for RADAR:1. Press the Open Installer Guide button in Getting Started live script or run NXP_Support_Package_RADAR command, and
- 33 (All time)
- 3 (Last 30 days)
- -- / 5
- Community
-
31 Oct 2024
Roundtrip Time Computation
A simple radar simulation which computes the roundtrip time of radar pulse based on the radar distance traveled.
- 721 (All time)
- 1 (Last 30 days)
- 5.0 / 5
- Community
-
2 May 2020

Various deep learning extensions in MATLAB.
updated to 2024a, mainly focusing on the E series (with additions of Radar and Wireless). Additionally, content for A7 and A8 has been added.Due to significant updates in version 2024a, the DL architecture
- 94 (All time)
- 2 (Last 30 days)
- -- / 5
- Community
-
5 Sep 2024

SAR Signal Processing with MatLab Algorithms - Reloaded
Upgrade and extension of m-scripts for M. Soumekh's book "Synthetic Aperture Radar Signal Processing with MatLab Algorithms".
Function Study for CSAR signal processing. 10. Reproduction of Radar Radiation Pattern figures of Chapter 3 (planar, circular, parabolic). 11. Accurate expression for the approximated
- 1.2K (All time)
- 15 (Last 30 days)
- 5.0 / 5
- Community
-
10 Feb 2025

This code is suitable for high-speed target detection and parameter estimation in the field of radar signal processing.
. Radon-Fourier Transform for Radar Target Detection, I: Generalized Doppler Filter Bank.[J]. IEEE Transactions on Aerospace & Electronic Systems, 2011.
- 395 (All time)
- 3 (Last 30 days)
- 5.0 / 5
- Community
-
23 Jun 2022

Laser Radar LADAR Simulator Matlab Code
This repository contains a Matlab implementation of the 3D LADAR Simulator Based on a Fast Target Impulse Response Generation Approach
# LADAR Simulator MATLAB CodeThis repository contains a Matlab implementation of the Development of a 3D LADAR Simulator Based on a Fast Target Impulse Response Generation Approach.This (Laser Radar
- 14 (All time)
- 3 (Last 30 days)
- -- / 5
- Community
-
3 Sep 2025
Example of Doppler radar signal processing
Example of Doppler radar signal processing
EXAMPLE SCRIPT FOR PROCESSING DOPPLER DATA AND PLOTTING RESULTS DATA WAS COLLECTED USING A FIXED FREQUENCY RADAR SENSOR OPERATING AT 10.525 GHZ. A HAND WAS PLACED ~ 30CM IN FRONT OF THE SENSOR AND
- 2.4K (All time)
- 1 (Last 30 days)
- 4.8 / 5
- Community
-
11 Jan 2015