
Create a spider or radar plot with individual axes.
[](https://www.mathworks.com/matlabcentral/fileexchange/59561-spider_plot)[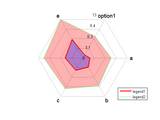
Spider(rader) Chart for Multi Data
Plots a radar (spider) chart for Multi-Data (no need of circle function here)
Plots a radar (spider) chart for Multi-Data.with changeable Label, LineColor, FillColor and LineStyle.
- 3.8K (All time)
- 5 (Last 30 days)
- 5.0 / 5
- Community
-
7 Feb 2011

spider(data,tle,rng,lbl,leg,f)
Plots matrix column data in a spider plot.
Function plots table data in a spider (or radar) plot form. Permits independent or global axis limit controls as well as axis labeling and data set labeling. Also allows for the plot axes to be
- 10.9K (All time)
- 1 (Last 30 days)
- 4.7 / 5
- Community
-
8 Apr 2015
Plotly | Online MATLAB Graphing
Publish your MATLAB figures to the web with one line of code.
Plotly (https://plot.ly/) is an online graphing platform that makes generating and sharing interactive, publication-quality figures easy.. This package converts your MATLAB figures into online Plotly
- 4.9K (All time)
- 33 (Last 30 days)
- 5.0 / 5
- Community
-
15 Aug 2024

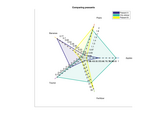
spiderplot(X, axisMax, axisMin, colors)
Creates a spider (radar) plot
SPIDERPLOT(X), where X is a M times N matrix, plots N radar plots to a figure with M axis.SPIDERPLOT(X [MxN], AXISMAX [Mx1], AXISMIN [Mx1], COLORS [Nx1 or Nx3]) uses AXISMIN and AXISMAX to scale the
- 5.3K (All time)
- 1 (Last 30 days)
- 4.5 / 5
- Community
-
1 Sep 2016
A variant on radar/spider plot where different dimensions can have different scaling
Plot NxM arrays as N different objects in a "scalar" M-dimensional space.
- 547 (All time)
- 1 (Last 30 days)
- 5.0 / 5
- Community
-
13 Oct 2016

- 195 (All time)
- 1 (Last 30 days)
- 4.0 / 5
- Community
-
16 Apr 2023

- 139 (All time)
- 1 (Last 30 days)
- 4.0 / 5
- Community
-
9 Sep 2022

area_spider_plot( data, plotArea )
Plot data in a circular spider (radar) plot either as lines or as shaded area.
Adapted from https://de.mathworks.com/matlabcentral/fileexchange/33134-radar-plot?focused=5201638&tab=function This function plots a spider plot using the columns of P as datapoints. Inputs
- 167 (All time)
- 3 (Last 30 days)
- -- / 5
- Community
-
29 May 2018

Plots a radar (spider) chart (no need of circle function here)
Takes a numeric verctor and cell string vector and plots a spider chart (One data set is allowed)
- 3K (All time)
- 2 (Last 30 days)
- 3.7 / 5
- Community
-
4 Sep 2008

PCA with Euclidean distances representation
Versatile function for representation of PCA scores together with Euclidean distances (Spider like plot).
plot can be automatically saved in current directory.
- 88 (All time)
- 1 (Last 30 days)
- 5.0 / 5
- Community
-
22 Jul 2021

- 453 (All time)
- 1 (Last 30 days)
- -- / 5
- Community
-
16 Jul 2024

AGENT-BASED HYBRID METAHEURISTIC FOR NUMERICAL MODEL UPDATE
This framework aims to provide flexible nondeterministic strategies to guide the numerical model updating process.
- 29 (All time)
- 1 (Last 30 days)
- -- / 5
- Community
-
7 May 2023

Hybrid Machine Learning and Agent-Based Metaheuristic
This framework combines autonomous agents and a decision tree to search for the optimal modal basis and vibration measurements prediction.
- 74 (All time)
- 1 (Last 30 days)
- -- / 5
- Community
-
23 Feb 2023

Grey Wolf Equilibrium Optimisation for Optimal Power Flow
The implementation for a Multi-objective Optimal Power Flow for Distribution Networks Utilizing Grey Wolf Equilibrium Optimizer
- 236 (All time)
- 8 (Last 30 days)
- -- / 5
- Community
-
17 Apr 2024

Core tools required for running Canlab Matlab toolboxes. The heart of this toolbox is object-oriented tools that enable interactive analysis
- 475 (All time)
- 3 (Last 30 days)
- -- / 5
- Community
-
16 Aug 2024
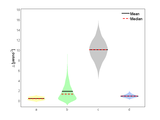
Violin Plot based on kernel density estimation, using default ksdensity
This function creates simple violin plots by estimating the kernel density, using matlabs default ksdensity(). Given a matrix or table with m columns, you will get violins for each of the columns
- 25.6K (All time)
- 105 (Last 30 days)
- 4.9 / 5
- Community
-
3 Nov 2015
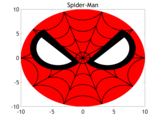
Run this file and you can get Spider-Man! You can get your original Spider-Man by just changing colors.
You will get Spider-Man by just using plot and fill.First, draw the outline and then draw the web and eyes using arcs with varying center points.
- 298 (All time)
- 2 (Last 30 days)
- 5.0 / 5
- Community
-
17 Dec 2018

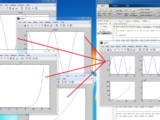
Bode plot with asymptotes
The function asymp() corresponds to bode(), but it also plots asymptotes for the magnitude and phase graphs. Phase asymptotes are only horizontal and vertical. asymp() only accepts SISO transfer
- 29K (All time)
- 116 (Last 30 days)
- 4.7 / 5
- Community
-
22 Sep 2020
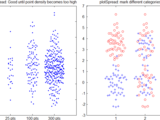
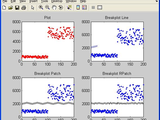
plot spread points (beeswarm plot)
plotSpread plots distributions of data points, adding jitter to the points to avoid overlap.
plotSpread allows creating "beeswarm plots", i.e. point distributions where jitter has been added to the data points to avoid overlap.It further allows specifying groups within the data to show the
- 12.8K (All time)
- 7 (Last 30 days)
- 4.9 / 5
- Community
-
11 Feb 2017
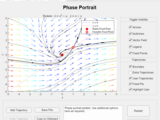
Plot the phase portrait for the entered system of differential equations
using the app. The app works with limited functionality for versions preceding R2020b. For versions prior to R2020b, mouse click interactions with the plots (adding trajectories and guessing solutions) do
- 8.7K (All time)
- 41 (Last 30 days)
- 5.0 / 5
- Community
-
28 Mar 2021
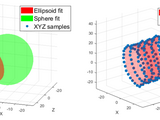
Object-oriented tools to fit/plot conics and quadrics
A tool set for fitting and/or plotting various conics and quadric surfaces, e.g., ellipses, cylinders, spheres, planes, cones, and lines.
This FEX submission offers a tool set for fitting and plotting 2D conics (ellipses, circles, lines,...) as well as 3D quadric surfaces (ellipsoids, spheres, planes, cylinders, cones,...). Each type
- 2.3K (All time)
- 7 (Last 30 days)
- 5.0 / 5
- Community
-
8 Feb 2024
- 7.1K (All time)
- 13 (Last 30 days)
- 4.7 / 5
- Community
-
31 Oct 2012
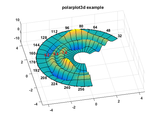
Plots 3d polar data with polar axis and polar grid
Polarplot3d produces surface, mesh, wireframe and contour plots for three dimensional polar data. A labeled polar axis is drawn at a fixed height or it can follow the surface contour at maximum
- 25.7K (All time)
- 12 (Last 30 days)
- 4.9 / 5
- Community
-
4 Mar 2016
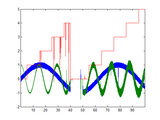
Produces a plot who's y-axis skips to avoid unnecessary blank space
Produces a plot who's y-axis skips to avoid unecesary blank spaceReplaces BREAKAXIS
- 16.8K (All time)
- 15 (Last 30 days)
- 5.0 / 5
- Community
-
12 Nov 2008

Generate a bar plot with multiple stacks grouped together.
Plot a set of stacked bars, but group them according to labels provided.Params: stackData is a 3D matrix (i.e., stackData(i, j, k) => (Group, Stack, StackElement)) groupLabels is a CELL
- 12.5K (All time)
- 15 (Last 30 days)
- 4.8 / 5
- Community
-
13 Sep 2011

This simple code enables you to plot using custom markers.
This simple code enables you to plot using custom markers. It uses custom patches instead of Matlab built-in markers.As the input, you need to provide x and y for the data points, like you do in
- 2.4K (All time)
- 2 (Last 30 days)
- 4.9 / 5
- Community
-
17 Dec 2012

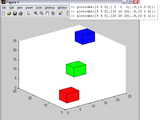
The program plots convex linear closed regions in 2D/3D.
The program plots convex linear closed regions in 2D/3D. The region is a subset of R2 or R3 such that Ax>=b and lb<=x<=ub. It is also possible to plot points in the same plot.(See help
- 16.8K (All time)
- 3 (Last 30 days)
- 4.6 / 5
- Community
-
24 Jun 2025

Spider Wasp Optimizer (SWO) is a nature-inspired meta-heuristic algorithm
Spider Wasp Optimizer (SWO) is a nature-inspired meta-heuristic algorithm, which is based on replicating the hunting, nesting, and mating behaviors of the female spider wasps in nature. This proposed
- 1.7K (All time)
- 5 (Last 30 days)
- 4.8 / 5
- Community
-
10 Mar 2023
Create an Arduino-based robotic spider using Simulink and Stateflow
This package contains files necessary to build your own robotic spider
This demo utilizes an Arduino board, 3D printed parts, eight servo motors and variousother supporting hardware components to control a robotic spider. The body of the spideris made of 3D printed
- 359 (All time)
- 2 (Last 30 days)
- 5.0 / 5
- Community
-
22 Sep 2016

Just like Microsoft Spider Solitare
I didn't have a copy of Spider Solitare, so I built one in Matlab. Have fun and enjoy. Use the 'Game' menu to choose the level of difficulty (number of different suits). Click once on card you want
- 1.6K (All time)
- 3 (Last 30 days)
- 4.0 / 5
- Community
-
16 May 2007

Simulates spectral phase interferometry for direct electric-field reconstruction (SPIDER).
This script simulates an electromagnetic pulse, a spectral phase interferometry for direct electric field reconstruction (SPIDER) measurement and reconstruction and compares it to the true electric
- 4.8K (All time)
- 2 (Last 30 days)
- 4.0 / 5
- Community
-
22 Jan 2009
Makes MATLAB's line plots much faster.
This simple tool intercepts data going into a plot and reduces it to the smallest possible set that looks identical given the number of pixels available on the screen. It then updates the data as a
- 5.5K (All time)
- 4 (Last 30 days)
- 4.8 / 5
- Community
-
12 Jun 2015
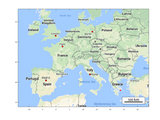
Plot a google map on the background of the current figure using the Static Google Maps API.
plot_google_map.m uses the Google Maps API to plot a map in the background of the current figure. It assumes the coordinates of the current figure are in the WGS84 datum, and uses a conversion code
- 32K (All time)
- 16 (Last 30 days)
- 4.9 / 5
- Community
-
22 Apr 2020

Violin Plots for plotting multiple distributions (distributionPlot.m)
Function for plotting multiple histograms side-by-side in 2D - better than boxplot.
The zip-file contains the following files for visualizing distributions:- distributionPlot.m: main function that allows creating violin plots - myHistogram.m: generate histograms with 'ideal' bin
- 14.8K (All time)
- 14 (Last 30 days)
- 5.0 / 5
- Community
-
11 Feb 2017

Professional Standard Plots within Seconds!!! Take your plots to the next level.
Create Professional standard plots in seconds, without a steep learning curve and with consistency. This Toolbox is supposed to help 'Beginners' take their plots to the next level with essentially
- 4.4K (All time)
- 12 (Last 30 days)
- 4.7 / 5
- Community
-
19 Oct 2022

Plot an n-dimensional gridded PDF as a corner plot
# plot_corner_pdf.mThis MATLAB function creates a corner plot of the discretized PDF represented by $X$ and $P$, where $X$ is the state coordinate matrix and $P$ is the probability at each of these
- 4 (All time)
- 4 (Last 30 days)
- -- / 5
- Community
-
18 Jun 2026

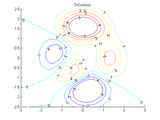
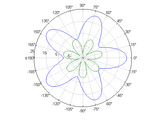
Creates a contour plot from polar coordinates
Have you ever wanted to do a contour plot of data in polar coordinates but didn't want to go through the hassle of converting it all to Cartesian coordinates? Well if so, here's your answer. A
- 5.7K (All time)
- 1 (Last 30 days)
- 4.4 / 5
- Community
-
18 Jun 2007
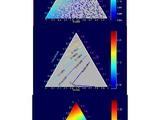
Zip file contains program to make different ternary plots.
This zip files contains programs (five functions, one example program, and one sample data set) to plot data in ternary diagrams. The first option is a pseudo color plot, the second is a contour plot
- 16.1K (All time)
- 24 (Last 30 days)
- 4.5 / 5
- Community
-
6 Jun 2005
Read and write files in SPIDER format
SPIDER is a free image processing system for electron microscopy. It is used for three-dimensional reconstruction of single particle macromolecules, multivariate statistical classification, and
- 903 (All time)
- 1 (Last 30 days)
- 4.0 / 5
- Community
-
19 May 2009
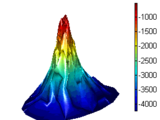
Making Surface Plots From Scatter Data
How to turn a collection of XYZ triplets into a surface plot.
How do you turn a collection of XYZ triplets into a surface plot? This is the most frequently asked 3D plotting question that I got when I was in Tech Support. This submission explains how.
- 38.6K (All time)
- 5 (Last 30 days)
- 4.6 / 5
- Community
-
1 Sep 2016
Polar plots with handle graphics type parameter setting. Includes log radius support.
Attempts to bring comprehensive handle graphics capabilities to polar plots.
- 5.4K (All time)
- 1 (Last 30 days)
- 4.9 / 5
- Community
-
31 Oct 2012
ScrollPlot - scrollable X/Y axes
ScrollPlot adds a scroll sub-window to any supplied plot handles
ScrollPlot adds a scroll sub-window to any supplied plot handles (or current [gca] axes if no handle was supplied). This enables easy plot or image exploration. The user can specify initial view
- 10.4K (All time)
- 2 (Last 30 days)
- 4.8 / 5
- Community
-
16 Jul 2015
Figure to play and analyze videos with custom plots on top
A figure ready to scroll through and play videos. You can also draw any custom graphics on it.
redraw at scroll position F (for example, REDRAW_FUNC can show the frame F of a video).This can be used not only to play and analyze standard videos, but it also lets you place any custom Matlab plots and
- 3.4K (All time)
- 4 (Last 30 days)
- 5.0 / 5
- Community
-
12 Dec 2010

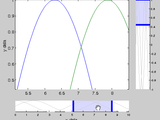
MATLAB Plot Gallery - Plot in Plot
Create a plot in plot
This is an example of how to create an inset plot within another plot in MATLAB®.Read about the "axes" function in the MATLAB documentation.For more examples, go to MATLAB Plot Gallery -
- 4K (All time)
- 2 (Last 30 days)
- 5.0 / 5
- Community
-
19 Dec 2018

Draw a box plot with various display options
NOTE: this function is now available from the IoSR Matlab Toolbox as iosr.statistics.boxPlot.-------------------------Alternative box plot function for Matlab with many options. These options include
- 10.9K (All time)
- 5 (Last 30 days)
- 4.7 / 5
- Community
-
28 Jun 2017

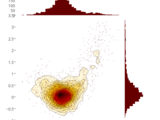
Plots data density of a two-dimensional distribution for human viewing.
Data density can be hard to read from scatter plots due to overstriking. I therefore calculate data density at each pixel as the reciprocal of the sum of squared distance from each point, adding a
- 6.9K (All time)
- 2 (Last 30 days)
- 4.1 / 5
- Community
-
29 Nov 2014

Plotting function that allows for N y-axes using a common x axis
This function allows for results to be plotted on N separate y-axes. These y-axes share a common x axis, but do not need to share exactly the same x/y data or size. The function supports all
- 3.4K (All time)
- 13 (Last 30 days)
- 4.9 / 5
- Community
-
11 Aug 2019

Adds zoomed plot inset to current axes.
Adds a zoomed plot inset to current axes, for use in highlighting a subarea of the current plot. [p,z] = zoomPlot(x,y,xbounds,pos,vertex) where: Inputs:x,y = vectors being plottedxbounds =
- 4.4K (All time)
- 14 (Last 30 days)
- 4.5 / 5
- Community
-
23 Oct 2016

Digitize chart data from an image.
Digitizer extracts data points from an image file. Plots in X/Y and Polar can be digitized.Demonstration of usage can be found at: https://youtu.be/zNYWioXi98wDigitizer is an app where you load an
- 1.9K (All time)
- 95 (Last 30 days)
- 5.0 / 5
- Community
-
6 Nov 2025
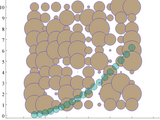
Simply plot filled circles or circle outlines.
Adding to the mix of circle plotters on the File Exchange site, this function plots any number of circles of any size and x,y location. Inputs can be any logical mix of scalars, vectors, or N-D
- 4.9K (All time)
- 2 (Last 30 days)
- 4.8 / 5
- Community
-
20 May 2019
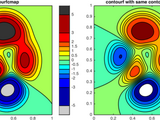
contourfcmap: filled contour plot with precise colormap
Creates a filled contour plot, with more precise control over colors than contourf.
# contourfcmap.m: filled contour plot with precise colormap[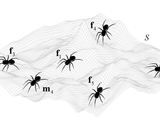
A swarm optimization algorithm inspired in the behavior of the social-spider
A swarm optimization algorithm inspired in the behavior of the social-spider
complex optimization problems. In this paper, a novel swarm algorithm called the Social Spider Optimization (SSO) is proposed for solving optimization tasks. The SSO algorithm is based on the simulation of
- 4.4K (All time)
- 2 (Last 30 days)
- 4.3 / 5
- Community
-
10 Jul 2014

Create a nested pie chart with customizable text.
[0.25, 0.25, 0.5];C = {... inner_pie,... % Inner to outer layer outer_pie};% Spider plotnested_pie(C,... 'PercentStatus', {'off', 'on'});% Titletitle('Nested Pie Chart');% Legend
- 289 (All time)
- 2 (Last 30 days)
- 5.0 / 5
- Community
-
16 Jul 2024
Plot lines with CData, (actually surface)
plots a 2-D "line" with c-data as colorMakes a surface object and the colouring is controlled by the colormap.Examples: x = 0:0.1:2*pi;color_line(x,sin(x),sin(x))color_line(x,cos(x),cos(x),'*')
- 4.2K (All time)
- 3 (Last 30 days)
- 4.3 / 5
- Community
-
7 Apr 2008
Plotting Components for Nirvana Distance
This function will plot the distance component that comprise the nirvana distance.
This function will plot the distance components as used to compute the nirvana distances for a set of augmentations used on a particular data set.This function uses the spider_plot_R2019b function
- 9 (All time)
- 3 (Last 30 days)
- -- / 5
- Community
-
20 Aug 2023
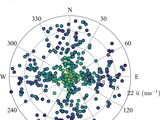
Plot a wind rose as a scatter plot
scatterWindRosePlot a wind rose as a scatter plotPlot a wind rose as a scatter plot with two or three variables to optimize the quantity of information that can be obtained on a single figure.The
- 2.5K (All time)
- 2 (Last 30 days)
- 5.0 / 5
- Community
-
15 Jul 2021
Plots 3D polar data with axes.
Polar3D plots 3 dimensional data given angular and radial ranges. A choice of plot types and interpolation methods is supported by this function. Useful particularly in producing 3D plots sampled on
- 20.6K (All time)
- 1 (Last 30 days)
- 4.8 / 5
- Community
-
8 Mar 2006
This code gets different single fig files and plot all of them together inside a new figure.
- 6.6K (All time)
- 3 (Last 30 days)
- 4.5 / 5
- Community
-
26 Mar 2020