627 results
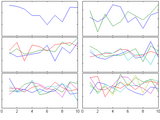
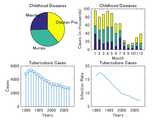
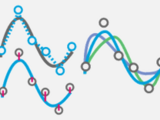
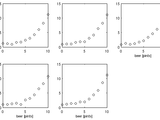
Fills the figure with axes subplots with easily adjustable margins and gaps between the axes.
Subplot tends to leave a lot of empty space around the axes. Tight_subplot allows to adjust the spacing between the axes as well as the margins around the axes.For example:[ha, pos] =
Use HTML jargon for multi axis layout.
SUBAXIS Create axes in tiled positions. (just like subplot) Usage: h=subaxis(rows,cols,cellno[,settings]) h=subaxis(rows,cols,cellx,celly[,settings
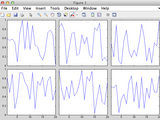
This code gets different single fig files and plot all of them together inside a new figure.
This code is used once there are several saved fig files and the goal is to open all of them together in a new figure as different subplots. The order of subplots is based on the order in which
Subplot wrapper, allowing better figure utilization, by tighter axes.
Allows fully utilizing the figure surface by defining margins, by wrapping the existing subplot function. Unfortunately the original subplots function spends lavishly the figure area , without

This code is to separate subplots into the full plot which you can save.
Please use "help Sub_Fig_Divider" and "help Example_File" to know how to use this code in separating the subplots.

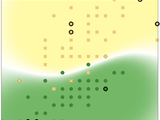
Creates subplot axes similar to the subplot function, but minimizes the white space between the different axes. Can be used for single axes.
Creates subplot axes similar to the subplot function, but minimizes the white space between the different axes. Similar to the "Expand axes to fill figure" command in the export tool but works for

Asymmetric subplots with variable inner gaps and outer margins.
subtightplot is a merger of Pekka Kumpulainen's tight_subplot and Nikolay S.'s subplot_tight. It extends the former, which supports asymmetric subplots, to allow for variable margins in addition to

An improved subplot function
Allows to control the distance between subplots, add labels on rows/columns only and more.% simple example:subplot1(2,3);subplot1(1); plot(rand(10,1));subplot1(2); plot(rand(10,1));...

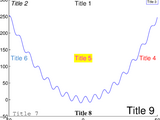
Places text as a title, xlabel, or ylabel on a group of subplots.
PLaces text as a title, xlabel, or ylabel on a group of subplots. Returns a handle to the label and a handle to the axis.[ax,h]=suplabel(text,whichLabel,supAxes)returns handles to both the axis and

Scrollplot with subplot handling.
Wolfgang Stiegmaier's scrollplot function (Steven Lord's scrollplotdemo) with subplot handling.% example% % temps = linspace(0,10*pi,100001);% Y1 = sin(temps);% Y2 = cos(temps);% Y3 = sin(temps).^2
Calculate subplot positions by specifying figure margins and axis scaling.
subfigrid(nrows,ncols,offset,scale)The spacing of axes using the subplot command can be quite large, and manipulating axis positions after plotting can be tricky. For publication quality graphics, it is better to specify the subplot

Makes it alot easier to make nice figures with the same x axis.
Features:* Automatically sets xlim to the same for all subplots Removes xticklabels where it is not needed.* Can join a subplots (if it is made with subplot instead of subaxis)* Can set the ylabel

Multi-Dimensional Data Visualization

Create a legend without duplicate entries or create 1 legend for multiple subplots.
removes duplicate values. This cleans up the legend when plotting in a loop or when the the same data appear more than once in a figure. This also makes it easy to use one legend across several subplots

Creates a one legend for many sub-plots in the same figure with your customized location
This script creates a one legend for many sub-plots in the same figure located in a customized location with a guidelines for most common location used while creating Matlab files
Like subplot, but easier, and WYSIWYG export to file. Also fixes dashed/dotted lines in export.
Panel is an alternative to Matlab's "subplot", providing easier control over layout (particularly, easy elimination of whitespace). It also fixes dashed/dotted lines during export to image files

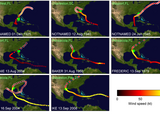
This code will generate an animation displaying the spread of COVID-19 and save it as a video file. Data is obtained and processed from HDX.
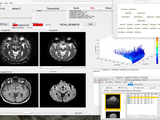
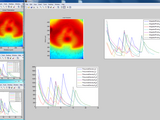
Medical software for Processing multi-Parametric images Pipelines

Build a figure with subplots given by an figures vector. Only axes are copied.
GRIDSUBPLOT build a figure with subplots given by an figures vector. Only axes are copied. F = GRIDSUBPLOT(FIG_VECTOR) build a figure F with with subplot given by the figures in FIG_VECTOR

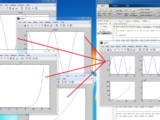
DRAGZOOM allows you to handy interactively manage the axes in figure.
:- Supports 2D-Plots, 3D-plots, Log plots and Images- Supports multiple mixed (subplots) (2D, 3D) axes on one figure- Supports X,Y,XY linking of several 2-D axes (Synchronize manage)- Rubber Band Region Zooming
Create a title for a figure with multiple subplots.
subplots.Syntax:figtitle('TitleString')figtitle('TitleString','TextProperty','TextValue')h = figtitle(...)Description:figtitle('TitleString') centers a title at the top of a figure and sets the figure name to 'TitleString'.figtitle('TitleString','TextProperty',TextValue) formats the title
Calculate how many rows and columns of sub-plots are needed to neatly display n subplots.
Sometimes a graphing function will not know in advance how many sub-plots are to be created. In this case hard-coding the number of rows and columns for the subplot command may not be possible. This

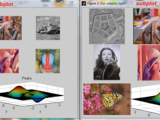
Display multiple images as a montage of subplots
Toolbox not required - Images are placed in subplots, so can be zoomed separately. - Small images are properly enlarged on screen. - Gaps can be placed between images. - Images can be viewed on a
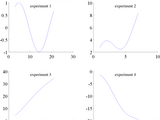
Create subplots with multiple plot types
This is an example of how to create subplots with multiple plot types in MATLAB®.Read about the "subplot" function in the MATLAB documentation.For more examples, go to MATLAB Plot Gallery -
Place a title inside a plot. Reduces title/xlabel ambiguity in figures with multiple subplots.
space. The ntitle function may prove particularly useful for figures with several subplots, where titles can sometimes become confused with xlabels above them. By default, ntitle centers the title at
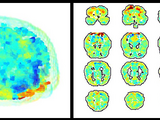
Quickly and easily create 2d and 3d plots of fMRI data.

subplotplus() is an enhanced alternative to the inherit subplot() function of MATLAB.
[subplot_handles,LabelsFontSize] = subplotplus(subplot_array,varargin) is an enhanced alternative to the inherit subplot() function of MATLAB. Using subplotplus() almost any layout of subplots can be

The STK is a (not so) Small Toolbox for Kriging

A Matlab Image segmentation via several feature spaces DEMO

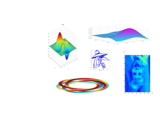
Simultaneously multivariate and multidimensional EMD

Automated data importing tool with time series management and visualization capabilities

DynaSim simplifies the process of building and simulating models of dynamical systems.

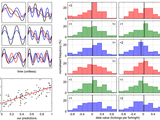
Demonstrates the abilities of Matlab functions lsqcurvefit, fmincon and fminsearch to fit complex mo
Function to align the ylabels within a figure containing multiple subplots
This function takes care of the alignment of ylabels in figures with multiple subplots.This is done because ylabels are usually not aligned when the yticks labels are of different length in different
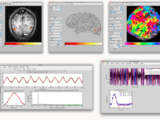
mrTools - matlab based tools for fMRI

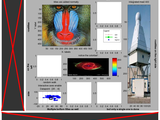
Interface for using finite elements in inverse problems with complex domains
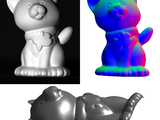
A matlab toolbox for photometric stereo.
A subplot figure with a lot of fancy features
SUBPLOT_GRID is a class with which a set of subplots can be created in a space-optimal way. In addition, a figure title and subtitle may be added, as well as specific row and column titles.Even after
Saves multiple MATLAB figure windows to powerpoint giving the user "subplot" style control over thei
Saves multiple MATLAB figure windows to powerpoint giving the user "subplot" style control over their positions in the final slide.Given multiple figures you can use commands like:subplot
Finer control over subplot spacing.
This function allows the user to easily exert finer control over the spacing between subplot panels. The function returns handles to subplots with the specified spacing.The user can specify the
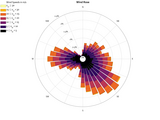
Graph and table for Direction-Intensity data
Variational Bayesian Analysis (VBA)
Creates Montage (subplots) of Specified Figures and their subplots
This creates a new figure containing subplots of other currently open figures including all non-colorbar axes in the figure (i.e. including subplots). example: i have figures 12 15 18 open. and I
Compute descriptive and inferential statistics for circular or directional data.
Free pattern recognition toolbox for MATLAB

scrollsubplot(n,m,p) p<0 and p>nm, Extends subplot to infinite canvas ...
also work with less regular subplot-layouts: axs3(1) = scrollsubplot(3,3,1); axs3(2) = scrollsubplot(3,3,3); axs3(3) = scrollsubplot(3,3,[4,7]); axs3(4) = scrollsubplot(3,3,5); axs3(5) =
Replot individual figures as sub axes on one figure with many subplots.
Take individual figures and put them together into one figure with multiple subplots.Inspiration from Bruno Luong
Scrollsubplot704 with dynamic range of time (x) axis, with subplot handling.
Further development of scrollsubplot(), scrollplotdemo() and scrollplot().In this version a figure handling and autoplot function is implemented.The new subplot handling inspired by Benoit Cantin
Combine axes in many figures into subplots in one figure.
This function allows the user to select figures and axes within figures and copy them as subplots into a new figure. A list of handles is the only mandatory argument. If a handle to an axes object is
Automatically apply x and y labels to subplots only along the edges.
function H=labelEdgeSubPlots(xl,yl,onlyBottom) Purpose If all subplots have the same quantities on the x and y axes then there's no point labeling all of them. Often it looks neater to simply
one time rescales all subplots of figure by x range
M-file. The function rescales all subplots of current figure by x range simultaneously. It gets start and stop points by parameters and uses it for all subplots. Function useful for the analysis of

This is a MatLAB function to compute linear-elastic damped response spectrum of time series

Make the most use of the matlab default figure set, adjust the position of the axes of subplot , remove white space,make figure tight.
Make the most use of the matlab default figure set, adjust the position of the axes of subplot , remove white space,make figure
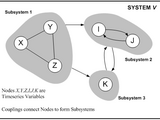
Functions for the delineation of Dynamical Process Networks using Information Theory
Image Compression Using SPIHT Algorithm.
Some tools for geostatistical analysis
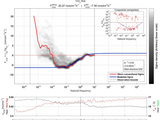
Ogive optimization toolbox for deriving surface fluxes in challenging environments

Matlab implementation of 'Image Recoloring Based on Object Color Distributions' Eurographics (short papers) 2019.

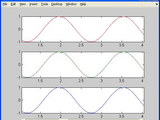
Tools to plot and manage vertically stacked time series with a common x axis.
detail and examples, as well as the example runnable script.Functions:-ts_figure-ts_subplot-ts_legend-ts_patch-ts_activateExamples:-ts_example.m (executable script)-example.jpg (example figure generated by

Release 6.1925 of a collection of functions for analysis/display of seismic and well-log data.
You can also select a web site from the following list
Americas
- América Latina (Español)
- Canada (English)
- United States (English)
Europe
- Belgium (English)
- Denmark (English)
- Deutschland (Deutsch)
- España (Español)
- Finland (English)
- France (Français)
- Ireland (English)
- Italia (Italiano)
- Luxembourg (English)
- Netherlands (English)
- Norway (English)
- Österreich (Deutsch)
- Portugal (English)
- Sweden (English)
- Switzerland
- United Kingdom(English)
Asia Pacific
- Australia (English)
- India (English)
- New Zealand (English)
- 中国
- 日本Japanese (日本語)
- 한국Korean (한국어)