tight_subplot(Nh, Nw, gap, marg_h, marg_w)
Fills the figure with axes subplots with easily adjustable margins and gaps between the axes.
Subplot tends to leave a lot of empty space around the axes. Tight_subplot allows to adjust the spacing between the axes as well as the margins around the axes.For example:[ha, pos] =
- 56.6K (All time)
- 61 (Last 30 days)
- 4.7 / 5
- Community
-
3 Mar 2016
Subplot wrapper, allowing better figure utilization, by tighter axes.
Allows fully utilizing the figure surface by defining margins, by wrapping the existing subplot function. Unfortunately the original subplots function spends lavishly the figure area , without
- 14.5K (All time)
- 3 (Last 30 days)
- 4.4 / 5
- Community
-
31 Jul 2016

Border-less tight subplot (auto-refresh)
Creates subplot axes similar to the subplot function, but minimizes the white space between the different axes. Can be used for single axes.
Creates subplot axes similar to the subplot function, but minimizes the white space between the different axes. Similar to the "Expand axes to fill figure" command in the export tool but works for
- 1.1K (All time)
- 2 (Last 30 days)
- 5.0 / 5
- Community
-
26 Jul 2018
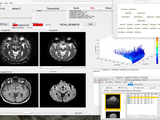
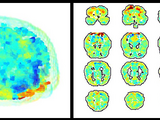
MP3 a medical imaging toolbox (MRI, CT, PET...)
Medical software for Processing multi-Parametric images Pipelines
- 1.3K (All time)
- 21 (Last 30 days)
- 5.0 / 5
- Community
-
18 Aug 2023

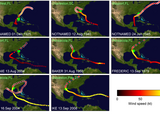
COVID-19 World Spread Animation
This code will generate an animation displaying the spread of COVID-19 and save it as a video file. Data is obtained and processed from HDX.
- 528 (All time)
- 1 (Last 30 days)
- 5.0 / 5
- Community
-
30 Apr 2020

Finer control over subplot spacing.
This function allows the user to easily exert finer control over the spacing between subplot panels. The function returns handles to subplots with the specified spacing.The user can specify the
- 590 (All time)
- 2 (Last 30 days)
- 5.0 / 5
- Community
-
3 Mar 2012
- 2.9K (All time)
- 3 (Last 30 days)
- 5.0 / 5
- Community
-
17 Jan 2017

kolian1/texture-segmentation-LBP-vs-GLCM
A Matlab Image segmentation via several feature spaces DEMO
- 2.1K (All time)
- 2 (Last 30 days)
- 5.0 / 5
- Community
-
30 Aug 2015

note : manual by user to adjust axis size and position of subplot to plot figure tightly
function tightly_SubPlot(m,n,scale,edge,name,type)% m as row num% n as col num% scale as axis size of each subplot, use to adjust distance between subplot % edge as the distance from the coordinate
- 59 (All time)
- 2 (Last 30 days)
- -- / 5
- Community
-
23 Aug 2020

Remove White Space,Make Subplot Tight
Make the most use of the matlab default figure set, adjust the position of the axes of subplot , remove white space,make figure tight.
tight.%***********************************************************************function [] = MakeSubplotTight(Hgcf,Nrow,Ncol)ORfunction [] = MakeSubplotTight(Hgcf,Nrow,Ncol,MarginLeft,MarginRight,MarginTop,MarginBottom,GapRow,GapCol)%Variables: At least 3 variables,and 6 optional
- 71 (All time)
- 1 (Last 30 days)
- 5.0 / 5
- Community
-
5 Oct 2022
ifi-beampattern-interval-analysis
An object-oriented package for beampattern interval analysis. This package is dependent on the complex interval arithmetic package.
- 12 (All time)
- 2 (Last 30 days)
- -- / 5
- Community
-
9 May 2023
Tight subplot with units in centimeter
Fork of tight_subplot function (submission #27991 by Pekka Kumpulainen)
Fork of tight_subplot function: https://www.mathworks.com/matlabcentral/fileexchange/27991-tight-subplot-nh--nw--gap--marg-h--marg-w-Units are in cm, making it easy to prepare a figure for a paper
- 293 (All time)
- 1 (Last 30 days)
- 4.5 / 5
- Community
-
13 Jul 2016
- 998 (All time)
- 4 (Last 30 days)
- 3.7 / 5
- Community
-
14 Jul 2015
HRViewer is a matlab software tool designed for in deep viewing and comparing HRV indices computed from different EKG files as well as diffe
- 187 (All time)
- 5 (Last 30 days)
- -- / 5
- Community
-
9 Dec 2019
- 493 (All time)
- 1 (Last 30 days)
- -- / 5
- Community
-
26 Nov 2020

Realtime signal analyzer (PDFs, correlation, audio playback and recording, spectrum analyzer)
- 78 (All time)
- 1 (Last 30 days)
- -- / 5
- Community
-
26 Feb 2016
GNSS2TWS_Slepian: A software to recover daily GNSS-inverted terrestrial water storage changes based on Slepian basis functions
- 16 (All time)
- 6 (Last 30 days)
- -- / 5
- Community
-
20 Oct 2024

Customizable version of standard MATLAB subplot function, for specifying axes positions and sizes.
Customized subplotting routine for cleaner/tighter/highly customizable axes compared to a standard MATLAB subplot. Basic functionality is largely the same as MATLAB's built in subplot, however this
- 45 (All time)
- 1 (Last 30 days)
- -- / 5
- Community
-
27 Jun 2024

Simple tools for demonstrating encoding and decoding a sequence of DTMF tones.
- 339 (All time)
- 3 (Last 30 days)
- -- / 5
- Community
-
30 Sep 2022
davestanley/MultiDimensionalDictionary
MDD allows the implementation of multidimensional Python-esque dictionaries in MATLAB.
- 112 (All time)
- 1 (Last 30 days)
- -- / 5
- Community
-
21 Aug 2017

DynaSim simplifies the process of building and simulating models of dynamical systems.
- 1.4K (All time)
- 1 (Last 30 days)
- 4.9 / 5
- Community
-
17 Feb 2022
- 4 (All time)
- 2 (Last 30 days)
- -- / 5
- Community
-
10 Jul 2024

For a tight, aligned matrix of axes
[ axeshandle, links ] = subplotN( ROWS , COLS, < index , switchorder >) subplotN(r,c) breaks the Figure window into an R-by-C matrix of small axes, and returns the axes handles. The axes
- 138 (All time)
- 1 (Last 30 days)
- -- / 5
- Community
-
11 Dec 2014

- 141 (All time)
- 1 (Last 30 days)
- -- / 5
- Community
-
11 Nov 2015
Simulation of the U.S. population dynamics in 2001-2011
Simulation of the U.S. population dynamics in 2001-2011
- 263 (All time)
- 1 (Last 30 days)
- -- / 5
- Community
-
14 Sep 2015

- 205 (All time)
- 1 (Last 30 days)
- -- / 5
- Community
-
25 Apr 2019

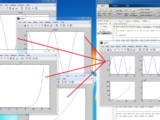
Two of my functions used for registration-matrix shifting as alternative to circshift.
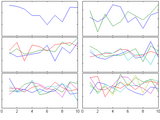
addition it supports only integer shift values, while fractional number sometimes needed. See subplot 1- with sky’s coming out of the ground. Sometimes it is better to assume zero values outside the image
- 1K (All time)
- 1 (Last 30 days)
- -- / 5
- Community
-
27 Jan 2014
Use HTML jargon for multi axis layout.
SUBAXIS Create axes in tiled positions. (just like subplot) Usage: h=subaxis(rows,cols,cellno[,settings]) h=subaxis(rows,cols,cellx,celly[,settings
- 29.2K (All time)
- 8 (Last 30 days)
- 4.8 / 5
- Community
-
9 Jul 2014

Asymmetric subplots with variable inner gaps and outer margins.
subtightplot is a merger of Pekka Kumpulainen's tight_subplot and Nikolay S.'s subplot_tight. It extends the former, which supports asymmetric subplots, to allow for variable margins in addition to
- 17.1K (All time)
- 16 (Last 30 days)
- 4.8 / 5
- Community
-
8 Jan 2013
Subplots without extra space in their twixt.
This function behaves like subplot, but sets figure margins to zero and leaves no space between subplots unless requested by the user. This is similar to other submissions on FEX including tight
- 663 (All time)
- 1 (Last 30 days)
- 5.0 / 5
- Community
-
11 Sep 2015
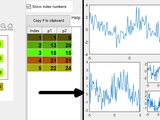
This code gets different single fig files and plot all of them together inside a new figure.
This code is used once there are several saved fig files and the goal is to open all of them together in a new figure as different subplots. The order of subplots is based on the order in which
- 6.6K (All time)
- 3 (Last 30 days)
- 4.5 / 5
- Community
-
26 Mar 2020
An improved subplot function
Allows to control the distance between subplots, add labels on rows/columns only and more.% simple example:subplot1(2,3);subplot1(1); plot(rand(10,1));subplot1(2); plot(rand(10,1));...
- 9.1K (All time)
- 1 (Last 30 days)
- 4.3 / 5
- Community
-
20 Jan 2006
Calculate subplot positions by specifying figure margins and axis scaling.
subfigrid(nrows,ncols,offset,scale)The spacing of axes using the subplot command can be quite large, and manipulating axis positions after plotting can be tricky. For publication quality graphics, it is better to specify the subplot
- 985 (All time)
- 1 (Last 30 days)
- 5.0 / 5
- Community
-
11 Aug 2016

Subplots Divided into Full Figures
This code is to separate subplots into the full plot which you can save.
Please use "help Sub_Fig_Divider" and "help Example_File" to know how to use this code in separating the subplots.
- 1.1K (All time)
- 3 (Last 30 days)
- 4.8 / 5
- Community
-
2 Apr 2019

Advanced Scroll Plot with Subplot Handling
Scrollplot with subplot handling.
Wolfgang Stiegmaier's scrollplot function (Steven Lord's scrollplotdemo) with subplot handling.% example% % temps = linspace(0,10*pi,100001);% Y1 = sin(temps);% Y2 = cos(temps);% Y3 = sin(temps).^2
- 2.4K (All time)
- 2 (Last 30 days)
- 4.7 / 5
- Community
-
9 Mar 2005
numSubplots - neatly arrange subplots
Calculate how many rows and columns of sub-plots are needed to neatly display n subplots.
Sometimes a graphing function will not know in advance how many sub-plots are to be created. In this case hard-coding the number of rows and columns for the subplot command may not be possible. This
- 1.9K (All time)
- 3 (Last 30 days)
- 4.7 / 5
- Community
-
7 Jan 2010

Customize spaces between subplots in a figure
wanted to save space by making tight subplots, so I wrote this function. Thought it will be useful to others too.>> Create your figure first, and then use spaceplots. It is a very non-intrusive
- 7.3K (All time)
- 2 (Last 30 days)
- 3.7 / 5
- Community
-
3 Jun 2013
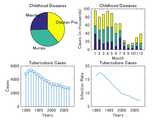
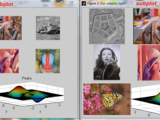
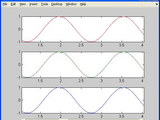
MATLAB Plot Gallery - Subplot (2)
Create subplots with multiple plot types
This is an example of how to create subplots with multiple plot types in MATLAB®.Read about the "subplot" function in the MATLAB documentation.For more examples, go to MATLAB Plot Gallery -
- 3K (All time)
- 1 (Last 30 days)
- 5.0 / 5
- Community
-
19 Dec 2018

subplotplus() - Enhanced layout MATLAB subplot function
subplotplus() is an enhanced alternative to the inherit subplot() function of MATLAB.
[subplot_handles,LabelsFontSize] = subplotplus(subplot_array,varargin) is an enhanced alternative to the inherit subplot() function of MATLAB. Using subplotplus() almost any layout of subplots can be
- 2.1K (All time)
- 1 (Last 30 days)
- 4.7 / 5
- Community
-
18 Jan 2012
Y-labels alignment in subplots
Function to align the ylabels within a figure containing multiple subplots
This function takes care of the alignment of ylabels in figures with multiple subplots.This is done because ylabels are usually not aligned when the yticks labels are of different length in different
- 2.1K (All time)
- 1 (Last 30 days)
- 5.0 / 5
- Community
-
18 Jun 2013

axshift() -funtion to manually resize and rescale subplots/axis within a figure
) rand(1)],'linewidth',2); title(num2str([i]),'fontweight','bold'); end subplot(4,3,i+1);image,axis tight;colorbar; subplot(4,3,i+2);image,axis tight;colorbar subplot(4,3,i+3);image,axis tight; axshift;
- 1.1K (All time)
- 1 (Last 30 days)
- 4.5 / 5
- Community
-
13 Apr 2009
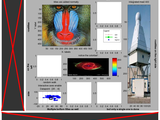
A subplot figure with a lot of fancy features
SUBPLOT_GRID is a class with which a set of subplots can be created in a space-optimal way. In addition, a figure title and subtitle may be added, as well as specific row and column titles.Even after
- 1.8K (All time)
- 1 (Last 30 days)
- 4.3 / 5
- Community
-
12 Jan 2015

samexaxis (nice subplots with same x axis)
Makes it alot easier to make nice figures with the same x axis.
Features:* Automatically sets xlim to the same for all subplots Removes xticklabels where it is not needed.* Can join a subplots (if it is made with subplot instead of subaxis)* Can set the ylabel
- 13.8K (All time)
- 1 (Last 30 days)
- 4.4 / 5
- Community
-
29 Mar 2005

Creates a one legend for many sub-plots in the same figure with your customized location
This script creates a one legend for many sub-plots in the same figure located in a customized location with a guidelines for most common location used while creating Matlab files
- 1.8K (All time)
- 1 (Last 30 days)
- 5.0 / 5
- Community
-
2 Nov 2010
Helps with organizing and referring to SUBPLOT axes with an interactive grid tile chooser.
This simple class helps with using SUBPLOT(M, N, P) by showing the SUBPLOT gridthat will be created. The user can interactively choose the grid tiles that shouldbe used for each axes by brushing the
- 94 (All time)
- 2 (Last 30 days)
- 5.0 / 5
- Community
-
23 Jul 2020
Advanced Scroll Subplot Function
Scrollsubplot704 with dynamic range of time (x) axis, with subplot handling.
Further development of scrollsubplot(), scrollplotdemo() and scrollplot().In this version a figure handling and autoplot function is implemented.The new subplot handling inspired by Benoit Cantin
- 2.5K (All time)
- 1 (Last 30 days)
- 4.5 / 5
- Community
-
16 Aug 2005
one time rescales all subplots of figure by x range
M-file. The function rescales all subplots of current figure by x range simultaneously. It gets start and stop points by parameters and uses it for all subplots. Function useful for the analysis of
- 867 (All time)
- 1 (Last 30 days)
- 4.5 / 5
- Community
-
14 Nov 2006
Saves multiple MATLAB figure windows to powerpoint giving the user "subplot" style control over thei
Saves multiple MATLAB figure windows to powerpoint giving the user "subplot" style control over their positions in the final slide.Given multiple figures you can use commands like:subplot
- 3.3K (All time)
- 1 (Last 30 days)
- 5.0 / 5
- Community
-
1 Sep 2016
Combine axes in many figures into subplots in one figure.
This function allows the user to select figures and axes within figures and copy them as subplots into a new figure. A list of handles is the only mandatory argument. If a handle to an axes object is
- 5.3K (All time)
- 2 (Last 30 days)
- 4.1 / 5
- Community
-
15 Feb 2008

Build a figure with subplots given by an figures vector. Only axes are copied.
GRIDSUBPLOT build a figure with subplots given by an figures vector. Only axes are copied. F = GRIDSUBPLOT(FIG_VECTOR) build a figure F with with subplot given by the figures in FIG_VECTOR
- 243 (All time)
- 1 (Last 30 days)
- 5.0 / 5
- Community
-
23 Dec 2011
- 161 (All time)
- 10 (Last 30 days)
- 5.0 / 5
- Community
-
16 Jul 2024
individualPlots2SubPlots-matlab
Replot individual figures as sub axes on one figure with many subplots.
Take individual figures and put them together into one figure with multiple subplots.Inspiration from Bruno Luong
- 19 (All time)
- 1 (Last 30 days)
- 5.0 / 5
- Community
-
9 Jan 2022

- 21.6K (All time)
- 10 (Last 30 days)
- 4.5 / 5
- Community
-
25 Jul 2017

The function implements LBP (Local Binary Pattern analysis), in a shift based manner.
- 1.1K (All time)
- 1 (Last 30 days)
- 4.5 / 5
- Community
-
21 Feb 2015

DRAGZOOM allows you to handy interactively manage the axes in figure.
:- Supports 2D-Plots, 3D-plots, Log plots and Images- Supports multiple mixed (subplots) (2D, 3D) axes on one figure- Supports X,Y,XY linking of several 2-D axes (Synchronize manage)- Rubber Band Region Zooming
- 5.8K (All time)
- 4 (Last 30 days)
- 4.9 / 5
- Community
-
5 Jun 2011

Remove excess margins from figures.
Alters a figure so that it has the minimum size necessary toenclose all axes in the figure without excess space around them.Works for figures containing multiple axes as subplots.Note that tightfig
- 29.6K (All time)
- 11 (Last 30 days)
- 4.8 / 5
- Community
-
13 Feb 2018
Creates Montage (subplots) of Specified Figures and their subplots
This creates a new figure containing subplots of other currently open figures including all non-colorbar axes in the figure (i.e. including subplots). example: i have figures 12 15 18 open. and I
- 1.8K (All time)
- 2 (Last 30 days)
- 4.8 / 5
- Community
-
3 Aug 2010
A single title on top of a subplot
Use this function to print a title on the top of a group of subplots
When using subtitle('MY TITLE','PorpertyName','PropertyValue'...), or subtitle('MY TITLE') after a group of subplots, then it provides a title MY TITLE with any property used that is defined in the
- 3.1K (All time)
- 1 (Last 30 days)
- 4.1 / 5
- Community
-
28 Jan 2016

Calculate the position of subplots when you want to plot similar figures togather.
subplot_position Calculate position of subplot axis [P_SUBPLOT,P_FIG] = subplot_position(X_WIDE,Y_WIDE,X_NUM,Y_NUM,FLAG_COLORBAR) x_wide, y_wide are width of x and y direction, in pixels
- 102 (All time)
- 2 (Last 30 days)
- -- / 5
- Community
-
24 Oct 2016

Fast and explainable clustering with CLASSIX
A fast and easy-to-use clustering method that provides explanations for the computed clusters.
- 99 (All time)
- 3 (Last 30 days)
- 5.0 / 5
- Community
-
12 Dec 2023