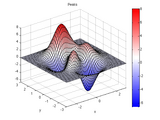
A colormap from bright blue, through white, and then to bright red.
REDBLUE(M), is an M-by-3 matrix that defines a colormap.The colors begin with bright blue, range through shades of blue to white, and then through shades of red to bright red. REDBLUE, by itself, is
- 23.3K (All time)
- 66 (Last 30 days)
- 5.0 / 5
- Community
-
9 Oct 2009

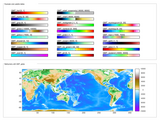
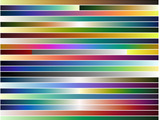
200 commonly used colormaps from matplotlab, scicomap, cmasher.
: Scientific colormaps for Python. https://github.com/ThomasBury/scicomapvan der Velden, E. (2020). CMasher: Scientific colormaps for Python. https://cmasher.readthedocs.io/Crameri, F. (2018). Scientific colour
- 14.6K (All time)
- 300 (Last 30 days)
- 4.8 / 5
- Community
-
18 Jun 2026
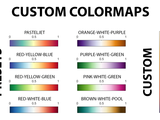
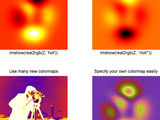
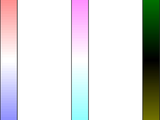
This function is able to define a customized colormap given the positions and the colors that are required to make the gradients.
', 'pink-white-green', 'brown-white-pool'.Example of use:J = customcolormap([0 0.5 1], {'#ffffff','#ff0000','#000000'});colorbar; colormap(J); axis off;
- 8.4K (All time)
- 36 (Last 30 days)
- 5.0 / 5
- Community
-
11 Sep 2019

ColorBrewer: Attractive and Distinctive Colormaps
The complete palette of ColorBrewer colormaps. Simple selection by scheme name and map length.
ColorBrewer 2.0 colorschemes for MATLAB, with simple selection by colormap length and scheme name. Alternatively the scheme name can be preselected, after which only the colormap length is required to define an
- 30.8K (All time)
- 106 (Last 30 days)
- 4.9 / 5
- Community
-
30 Mar 2026

Use the cubehelix algorithm to generate colormaps suitable for grayscale conversion
Exchange](https://www.mathworks.com/matlabcentral/images/matlab-file-exchange.svg)](https://www.mathworks.com/matlabcentral/fileexchange/43700)[](https://matlab.mathworks.com/open/github/v1?repo=DrosteEffect/CubeHelix)CUBEHELIX generates colormaps
- 4.5K (All time)
- 3 (Last 30 days)
- 4.9 / 5
- Community
-
31 Mar 2026
cmocean perceptually-uniform colormaps
Perceptually-uniform colormaps inspired by oceanography
These colormaps were developed by Kristen Thyng using viscm. They are perceptually uniform, as color should be when it serves as a numeric axis. If these colormaps are useful for you, please consider
- 16.1K (All time)
- 138 (Last 30 days)
- 5.0 / 5
- Community
-
7 Sep 2021
crameri perceptually uniform scientific colormaps
Perceptually uniform scientific colormaps from Fabio Crameri.
AboutA simple Matlab function for Fabio Crameri's perceptually uniform scientific colormaps.Usagecrameri without any inputs displays the options for colormaps.crameri ColormapName sets the colormap
- 6K (All time)
- 102 (Last 30 days)
- 5.0 / 5
- Community
-
12 Nov 2022
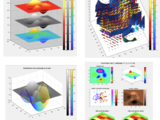
Use multiple colormaps per figure or axis! Works for many types of objects, not only images.
freezeColors/unfreezeColorsfreezeColors allows multiple colormaps to be used per figure and even within a single axis.HistoryIn 2005 freezeColors was written to enable multiple colormaps in a single
- 51.6K (All time)
- 27 (Last 30 days)
- 4.7 / 5
- Community
-
25 Jul 2022
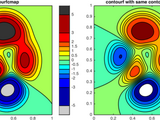
contourfcmap: filled contour plot with precise colormap
Creates a filled contour plot, with more precise control over colors than contourf.
# contourfcmap.m: filled contour plot with precise colormap[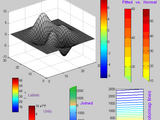
COLORMAP and COLORBAR utilities (Jul 2014)
MATLAB color utilities including COLORMAP join and interpolation; freeze and fit COLORBAR, etc.
These are some utilities that improve the COLORMAP and COLORBAR functions. They are as follows, and each one includes help and examples: COLORMAP utilites:cmapping - Colormap linear
- 24.3K (All time)
- 1 (Last 30 days)
- 4.5 / 5
- Community
-
3 Jul 2014

MatPlotLib "Perceptually Uniform" Colormaps
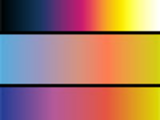
MatPlotLib's default linear lightness colormap VIRIDIS and distinctive line colororder TAB10
From MatPlotLib 2 and 3:the default sequential colormap VIRIDIS (as well as INFERNO, MAGMA, and PLASMA),the default line colororder TAB10 (as well as TAB20, TAB20B, and TAB20C),the cyclic colormaps
- 8.3K (All time)
- 117 (Last 30 days)
- 4.9 / 5
- Community
-
12 Mar 2026
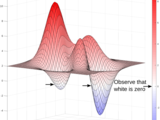
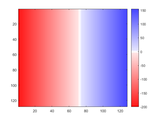
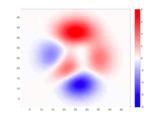
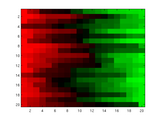
Colormap that linearly varies between red (+) white (=0) and blue(-)
This is a diverging colormap that linearly varies between red (+) white (=0) and blue(-).Just observe the figure
- 1.3K (All time)
- 18 (Last 30 days)
- 5.0 / 5
- Community
-
4 Feb 2021
Perceptually uniform colormaps
New Improved colormaps taken from python.
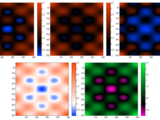
Perceptually uniform colormaps adds 4 new colormaps that are:1) Perceptually uniform (delta color is equal in all delta data)2) Colorblind friendly3) Good at grayscale conversion4) Pretty!Colormaps
- 15.5K (All time)
- 72 (Last 30 days)
- 4.9 / 5
- Community
-
2 Oct 2019
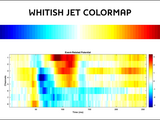
Jet-based colormap that contains white in its middle point.
This function defines a new colormap with the same colors that "jet", but it also replaces the green tones with white ones. This is specially useful when a signed metric is depicted, and its null
- 1.2K (All time)
- 1 (Last 30 days)
- 5.0 / 5
- Community
-
21 May 2018
Perceptually improved colormaps
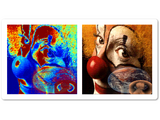
7 perceptual colormaps with rainbow-like colors and 1 with heat colors
PMKMP Returns perceptually balanced colormaps PMKMP(N,SCHEME) returns an Nx3 colormap. usage: map=pmkmp(n,scheme);%% Example1: 128-color rainbow with cubic-law luminance (default) load mandrill
- 8.7K (All time)
- 3 (Last 30 days)
- 5.0 / 5
- Community
-
14 Nov 2014
Create tints of colors and colormaps
Create specified tints of colors and colormaps or show examples of tints.To create shades, see http://www.mathworks.com/matlabcentral/fileexchange/47245-color-shades
- 465 (All time)
- 1 (Last 30 days)
- 5.0 / 5
- Community
-
16 Jul 2014
newcolorbar: multiple colormaps in the same axes
Create multiple colormaps and colorbars in (seemingly) the same set of axes.
This function creates a new set of invisible axes matching the size and extents of the current axes. This allows additional colormaps to be used in such a way that they are perceived as multiple
- 1.3K (All time)
- 2 (Last 30 days)
- 5.0 / 5
- Community
-
16 Aug 2015
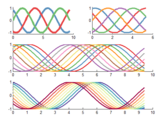
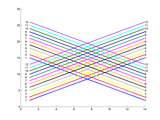
Beautiful and distinguishable line colors + colormap
Plot lots of lines with very distinguishable and aesthetically pleasing colors. Works for 'N' colors
The default Matlab default line spec and colormaps are astoundingly crude. This function creates distinguishable colors by spacing them out ~equally in *perceptive* space, not in RGB space. It is
- 28.3K (All time)
- 37 (Last 30 days)
- 4.9 / 5
- Community
-
16 Sep 2015

Maximally Distinct Color Generator
Generate maximally-distinct colors in an RGB colormap.
MAXDISTCOLOR generates an RGB colormap of maximally-distinct colors. The distance between the colors is measured in a perceptually uniform colorspace, which by default is OKLab
- 2.3K (All time)
- 15 (Last 30 days)
- 5.0 / 5
- Community
-
1 Apr 2026
Simple Matlab and python script that import colormaps from matplotlib into Matlab.
PyColormap4MatlabSimple Matlab and python script that import colormaps from matplotlib into Matlab.getPyPlot_cMap returns any colormap implemented in the matplotlib python library. It calls a python
- 4.1K (All time)
- 16 (Last 30 days)
- 4.9 / 5
- Community
-
17 Feb 2022
Symmetric/diverging/bipolar cold-neutral-hot colormap
colormap with a linear intensity/luminance variation when results are converted to grayscale. This requires the neutral gray-level to be 0.5.
- 3.6K (All time)
- 3 (Last 30 days)
- 5.0 / 5
- Community
-
11 Dec 2009
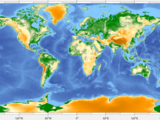
Color Palette Tables (.cpt) for Matlab
Create and apply GMT-style colormaps in Matlab
Exchange](https://www.mathworks.com/matlabcentral/images/matlab-file-exchange.svg)](https://www.mathworks.com/matlabcentral/fileexchange/28943-color-palette-tables-cpt-for-matlab)This function creates and applies a colormap defined in a color palette table (.cpt file). Color palette files provide more flexible colormapping than Matlab's default schemes, including both discrete
- 7.7K (All time)
- 4 (Last 30 days)
- 5.0 / 5
- Community
-
9 Aug 2024
Buillds any sequence of colormaps based on wrgbcmyk colors
This function can be used to build your own custom colormaps. Imagine if you want to display rainfall distribution map. You want a colormap which ideally brings rainfall in mind, which is not
- 3.5K (All time)
- 4 (Last 30 days)
- 4.9 / 5
- Community
-
14 Feb 2013
RedBlue Colormap Generator with Zero as White or Black
A colormap generator to display positive values as blue and negative values as red. Zero is displayed as either white or black.
Generates a RED-BLUE colormap with zero as white or black. Positive values are displayed as blue intensities and negative values are displayed as red intensities. Zero can be selected to be either
- 1.7K (All time)
- 12 (Last 30 days)
- 5.0 / 5
- Community
-
4 May 2020
A colormap that attempts to be color blind friendly
- 2.5K (All time)
- 11 (Last 30 days)
- 5.0 / 5
- Community
-
30 May 2014
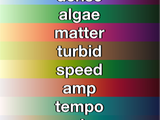
A collection of colormaps from https://matplotlib.org/cmocean/
A collection of perceptually uniform colormaps copied from https://matplotlib.org/cmocean/To set the colormap, use "colormap(Colormap.[mapname])"The [mapname] matches the names given in the original
- 1.2K (All time)
- 11 (Last 30 days)
- 5.0 / 5
- Community
-
24 Jul 2019

geoscience-community-codes/GISMO
GISMO - a framework for scientific research in seismology/infrasound
- 6.6K (All time)
- 15 (Last 30 days)
- 5.0 / 5
- Community
-
13 Apr 2023
Performs advaced colormap operations
ADVANCEDCOLORMAP Performs advaced colormap operationscmap = AdvancedColormap; Returns current colormap, much like COLORMAP does, but new figure is not createdcmaps =
- 2.7K (All time)
- 2 (Last 30 days)
- 5.0 / 5
- Community
-
1 May 2013
Superimpose multiple semitransparent images with individual colormaps on the current axis.
Remaps CData for multiple images, plotted in the current axis, to their respective individual colormaps. Multiple examples provided. The examples also demonstrate how semitransparent effects can be
- 1.2K (All time)
- 1 (Last 30 days)
- 5.0 / 5
- Community
-
3 Mar 2012
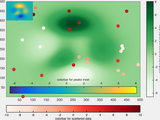
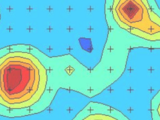
Colormap with zero-center white shading.
When representing "polarized" data for which zero and sign are meaningful (like for instance, a gravity anomalies map), it is useful to have a colormap where white stands for zero value, and greater
- 3K (All time)
- 3 (Last 30 days)
- 5.0 / 5
- Community
-
13 Jun 2012
CI-ImagingLIF, Access Leica LIF and XLEF Files
Access Leica LIF and XLEF Files
: https://github.com/acampb311/xml2structAdvancedColormap: Andriy Nych (2023). (https://www.mathworks.com/matlabcentral/fileexchange/41583-advancedcolormap), MATLAB Central File Exchange. Retrieved April 18, 2023.
- 1.1K (All time)
- 3 (Last 30 days)
- 5.0 / 5
- Community
-
18 Apr 2023
- 1.7K (All time)
- 3 (Last 30 days)
- 5.0 / 5
- Community
-
12 Jun 2019

Reconstruction and Spectral Analysis for Optical Coherence Tomography
A code for reconstruction and spectral analysis of spectral domain OCT images.
- 1.6K (All time)
- 4 (Last 30 days)
- 5.0 / 5
- Community
-
20 Apr 2017
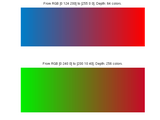
colorGradient: generate custom linear colormaps
COLORGRADIENT allows you to generate a linear color gradient from color A to color B.
User can generate a custom linear colormap giving 2 colors and colormap depth.Colors are given as vectors with RGB values. The suggested input method is using intensity values for each channel (0,1
- 3.5K (All time)
- 1 (Last 30 days)
- 4.9 / 5
- Community
-
22 May 2011
- 4K (All time)
- 26 (Last 30 days)
- 5.0 / 5
- Community
-
15 Jul 2024

- 7.3K (All time)
- 49 (Last 30 days)
- 4.9 / 5
- Community
-
8 Aug 2024
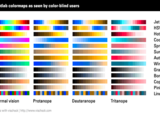
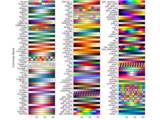
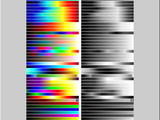
Matlab colormaps as seen by color-blind users
This image provides simulations of how the standard Matlab colormaps look to color-blind users.
The choice of colormaps for data visualization can affect the information accessible to color-blind users. For example large patches of cyan in an image with a bitonal cyan-magenta colormap (Matlab
- 2.3K (All time)
- 3 (Last 30 days)
- 5.0 / 5
- Community
-
3 Aug 2011
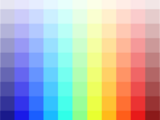
COLORMAPS3C lets you create your own colormaps.
COLORMAPS3C is able to create a custom colormap by specifying the 3 colors that you want to use in your colormap. The first will be at the bottom of the scale, the second will be the intermediate and
- 1.5K (All time)
- 1 (Last 30 days)
- 5.0 / 5
- Community
-
19 May 2004
Diverging Redblue colormap from Tecplot
Generates the diverging redblue colormap from Tecplot. I needed a few times to display independent color bars on papers using tecplot charts
Generates the diverging redblue colormap from Tecplot. I needed a few times to display independent color bars on papers using tecplot charts.Inspired by
- 500 (All time)
- 2 (Last 30 days)
- 5.0 / 5
- Community
-
30 Nov 2018
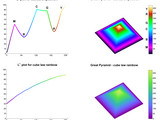
Adaptive Colormap Function Creates a Colormap Specific to Data
Easily design and fit a colormap to the values in your data!
Tristan Ursell Nov 2013 Adaptive colormap rgbslide(mat_in,...) slide_map = rgbslide(...); This function creates, on the fly, an active / adaptive colormap for the data given by the matrix
- 989 (All time)
- 1 (Last 30 days)
- 5.0 / 5
- Community
-
29 Oct 2013
Converts intensity matrices into truecolor images.
input colormap. The output can be displayed using IMAGE or IMSHOW, exported using IMWRITE, used for texture mapping, etc.Colormaps are specified either by name, or as a JxK colormap table (K = 3 or 4
- 8.3K (All time)
- 3 (Last 30 days)
- 4.9 / 5
- Community
-
8 Jul 2014
- 610 (All time)
- 5 (Last 30 days)
- 5.0 / 5
- Community
-
20 Jun 2021

Colormap in blue, white and red.
- 2.6K (All time)
- 1 (Last 30 days)
- 5.0 / 5
- Community
-
16 Mar 2006

Zeffiro Forward and Inverse Interface for Complex Geometries
Interface for using finite elements in inverse problems with complex domains
- 650 (All time)
- 3 (Last 30 days)
- 5.0 / 5
- Community
-
11 Aug 2024
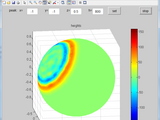
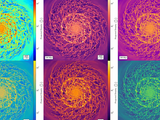
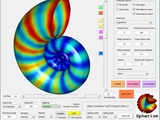
It is wave equation on sphere surface. Land influence neglected. There are colormap and lands veiw.
influence neglected. triangular mesh used. The method is some kind of finite difference method. See fromulas in laplacian.jpg Matlab simulations.run colormap_gui.m to run GUI with colormap visualization.run
- 17.4K (All time)
- 2 (Last 30 days)
- 5.0 / 5
- Community
-
1 Sep 2011
- 809 (All time)
- 4 (Last 30 days)
- 5.0 / 5
- Community
-
13 Sep 2022
- 412 (All time)
- 1 (Last 30 days)
- 5.0 / 5
- Community
-
9 Aug 2021

Colormaps from NCAR Command Language (NCL).
Acknowledgement & Source: All colormap data in this file are sourced from NCAR Command Language (NCL) Website: https://www.ncl.ucar.edu/Document/Graphics/color_tables.shtmlList for
- 1.1K (All time)
- 18 (Last 30 days)
- 5.0 / 5
- Community
-
21 Jun 2026
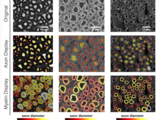
Returns a colormap for visualizing gene expression.
a simple function that returns a colormap, C, for visualizing gene expression. C is just a N x 3 matrix [R G B] describing the range of color values.example usage: C =
- 2.6K (All time)
- 1 (Last 30 days)
- 5.0 / 5
- Community
-
9 Dec 2004
- 737 (All time)
- 1 (Last 30 days)
- 5.0 / 5
- Community
-
18 Apr 2013
- 414 (All time)
- 2 (Last 30 days)
- 5.0 / 5
- Community
-
30 Jun 2017
Creates a colormap using two boundary colors and one center color
Creates a colormap using two boundary colors and one center color. Useful in situations containing positive and negative values, where the central color (normally white) is zero. The user can define
- 415 (All time)
- 3 (Last 30 days)
- 5.0 / 5
- Community
-
11 Mar 2019

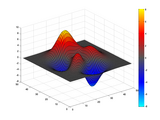
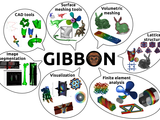
Useful tool for rendering and outputting information rich images
an output variable - useful for saving to disk, texture mapping surfaces, and post-rendering manipulation such as overlaying/combining two or more images.All the MATLAB built-in colormaps are
- 18K (All time)
- 2 (Last 30 days)
- 4.7 / 5
- Community
-
23 Jun 2020

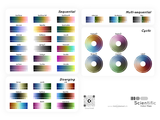
A simple tool for creating attractive and perceptually smooth colormaps
This tool simplifies the creation of perceptually linear and/or smooth colormaps for data visualization. The tool works by using palette colors selected by the user and performing all interpolations
- 19 (All time)
- 3 (Last 30 days)
- 5.0 / 5
- Community
-
23 Jun 2023
Colormaps compatible with red-green color perception deficiencies
Colormaps for displaying data compatible with red-green color perception deficiencies
contrast while being a good compromise for readers with color perception deficiencies. These colormaps are designed to be printer-friendly both for color printers as as well as B&W printers.The colormap
- 1.9K (All time)
- 6 (Last 30 days)
- 5.0 / 5
- Community
-
18 Apr 2013

Release 6.1925 of a collection of functions for analysis/display of seismic and well-log data.
- 9.4K (All time)
- 4 (Last 30 days)
- 4.9 / 5
- Community
-
8 Jul 2009

MATLAB & Bash Scripts for localizing and interactivity visualizing intracranial electrode data
- 857 (All time)
- 2 (Last 30 days)
- 5.0 / 5
- Community
-
11 Jun 2022
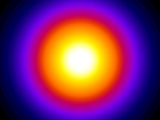
Fire and/or Custom Colormap Function
Use the 'fire' colormap in Matlab, or create your own.
FIRE Blue-Purple Hot colormapFIRE(M) returns an M-by-3 matrix containing a "fire" colormap.FIRE, by itself, is the same length as the current figure's colormap. If no figure exists, MATLAB creates
- 1.5K (All time)
- 8 (Last 30 days)
- 5.0 / 5
- Community
-
19 Mar 2012

- 5.5K (All time)
- 8 (Last 30 days)
- 4.7 / 5
- Community
-
25 Aug 2015
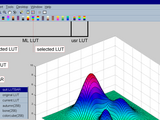
lutbar: a pedestrian colormap toolbar/contextmenu creator
LUTBAR creates a colormap toolbar and context menu
if you are tired of trying colormap(xxx) at the command prompt to find the appropriate colormap for your figure - try LUTBARLUTBAR creates a colormap toolbar with colormap icons and context menu from
- 4K (All time)
- 1 (Last 30 days)
- 4.8 / 5
- Community
-
21 Jan 2008