grid
Display or hide axes grid lines
Description
grid on displays the major grid lines for the current axes returned by
the gca command. Major grid lines extend from each tick
mark.
grid off removes all grid lines from the current axes or chart.
grid toggles the visibility of the major
grid lines.
grid minor toggles the visibility of the minor grid lines. Minor grid
lines lie between the tick marks. Not all types of charts support minor grid
lines.
grid( displays or hides
the grid by specifying a visibility)visibility value. You can specify
visibility as "on",
"off", a logical value, or an
OnOffSwitchState value.
Examples
Display the grid lines for a sine plot.
x = linspace(0,10);
y = sin(x);
plot(x,y)
grid on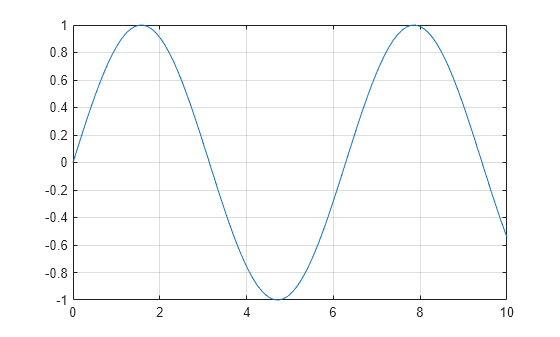
Create a surface plot and remove the grid lines.
[X,Y,Z] = peaks;
surf(X,Y,Z)
grid off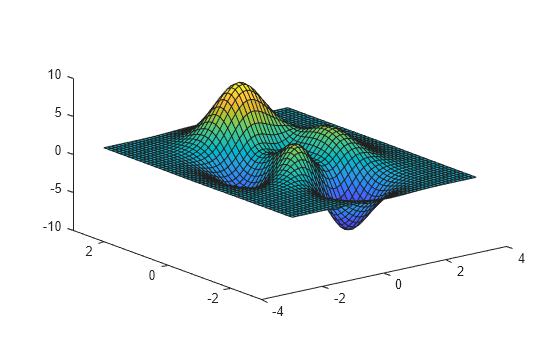
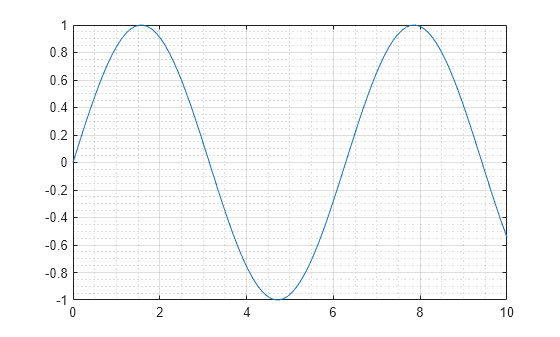
Display the major and minor grid lines for a sine plot.
x = linspace(0,10);
y = sin(x);
plot(x,y)
grid on
grid minor
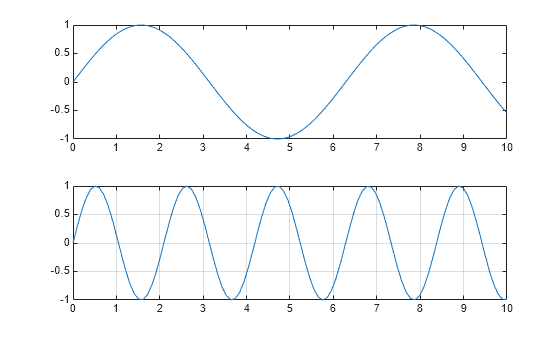
Starting in R2019b, you can display a tiling of plots using the tiledlayout and nexttile functions. Call the tiledlayout function to create a 2-by-1 tiled chart layout. Call the nexttile function to create the axes objects ax1 and ax2. Plot data into each axes. Then display grid lines in the bottom plot by passing ax2 to the grid function.
x = linspace(0,10);
y1 = sin(x);
y2 = sin(3*x);
tiledlayout(2,1)

% Top plot
ax1 = nexttile;
plot(ax1,x,y1)

% Bottom plot
ax2 = nexttile;
plot(ax2,x,y2)
grid(ax2,'on')
Input Arguments
Tips
When working with Cartesian axes, some axes properties affect the appearance of the grid lines. This table lists a subset of axes properties related to the grid lines.
Axes Property Description XTick,YTick,ZTickLocation of tick marks and major grid lines for each axis direction XGrid,YGrid,ZGridDisplay of major grid lines for each axis direction XMinorGrid,YMinorGrid,ZMinorGridDisplay of minor grid lines for each axis direction LineWidthLine width of grid lines, axes box outline, and tick marks GridLineStyleMajor grid line style MinorGridLineStyleMinor grid line style GridColorMajor grid line color MinorGridColorMinor grid line color GridAlphaMajor grid line transparency MinorGridAlphaMinor grid line transparency LayerLocation of grid lines in relation to the plotted data When working with polar axes, some polar axes properties affect the appearance of the grid lines. This table lists a subset of polar axes properties related to the grid lines.
PolarAxes Property Description ThetaTick,RTickLocation of tick marks and major grid lines for each axis direction ThetaGrid,RGridDisplay of major grid lines for each axis direction ThetaMinorGrid,RMinorGridDisplay of minor grid lines for each axis direction LineWidthWidth of outline, tick marks, and grid lines GridLineStyleMajor grid line style MinorGridLineStyleMinor grid line style GridColorMajor grid line color MinorGridColorMinor grid line color GridAlphaMajor grid line transparency MinorGridAlphaMinor grid line transparency LayerLocation of grid lines in relation to the plotted data
When working with geographic axes, some geographic axes properties affect the appearance of the grid lines. This table lists a subset of geographic axes properties related to the grid lines. Note that
GeographicAxesobjects do not support minor grid lines.GeographicAxes Property Description GridDisplay of latitude and longitude grid lines LineWidthLine width of grid lines, box outline, and tick marks GridLineStyleGrid line style GridColorColor of grid lines GridAlphaGrid line transparency
Algorithms
The grid function sets these graphics object
properties to either 'on' or 'off':